Diffraction from a single slit. Young's experiment with finite slits.
Diffraction from a single slit gives a characteristic pattern. It also complicates the pattern from Young's experiment. Here we use phasor addition to derive the intensity as a function of angle for both situations. This page supports the multimedia tutorial Diffraction.
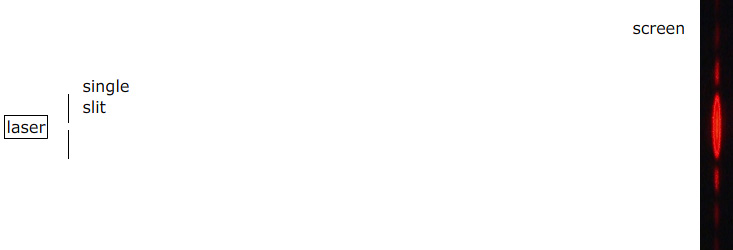
A laser illuminates a single slit and the resultant patten is projected on a distant screen.
The sketch shows the view from above a single slit. Let's assume that the slit is constant width and very tall compared with that width, so that we can consider the system as two-dimensional. With light at normal incidence, the pattern is symmetrical about the axis of the slit. On a distant screen, the light arriving on the axis from all points in the slit has travelled an equal distance from the slit, so the centre of the pattern is a maximum. The next question is what determines its width.
A larger view of the diffraction pattern.
Notice the broad central maximum, and the equally spaced, successively weaker maxima on either side.
First order minima
This animated sketch shows the angle of the first order minima: the first minimum on either side of the central maximum. We call the slit width a, and we imagine it divided into two equal halves. Using the Huygens' construction, we consider a point at the very top of the slit, and another point a distance a/2 below it, i.e. a point at the very top of the lower half of the slit. Consider parallel rays from both points, at angle θ to the axis of symmetry. (Why parallel? Because the screen is distant. Typically in diffraction experiments, the slit is ~ 10 µm wide, while the distance to the screen might be ~ 1 m.)
The ray from the distance a/2 below has to travel an extra distance (a sin θ/2). If this distance is half a wavelength, i.e. if
a sin θ = λ
then they are π/2 out of phase and they
interfere destructively. Now, for every point in the top half of the slit, there is one in the bottom half a distance a/2 below and, at the angle that satisfies a sin θ = λ,
they all interfere destructively.
So the first mimimum has sin θ = λ/a. On the other side of the axis of symmetry, sin θ = –λ/a is also a minimum. These two minima limit the broad central maximum.
The angle of the first order minima
Higher order minima
An argument like the one applies if, in our imagination, we divide the slit into any even number of equal slices. THe diagram shows a division into four. Each half is divided into quarters, and light from a source in the first quarter cancels that from one in the second quarter. Similarly, sources in the third quarter are nullified by those in the fourth quarter. So this diagram represents the second order minima, where sin θ = λ/(a/2), or sin θ = 2λ/a. For the nth order minima, we have
a sin θ = nλ
, where n is an integer, but not zero.
Remember that, on the axis where θ = 0, there is a minimum, so the minima are equally spaced in sin θ, except either side of the central maximum.
We can note too that, for light diffracting the throught slits, the slit is usually much wider than a wavelength, so the pattern is usually very small, so the approximation that sin θ = θ is usually good.
Next we calculate how the intensity varies with sin θ.
The arc made of very many phasors has the same length as the central amplitude A0.
The slit of width a is divided into N slits, each of width δa. The path difference between rays from successive slices of the slit are equal, and so too are the angles between successive phasors. The slices of the slit all have equal width and length, so the lengths of all the phasors are equal. For a large number of slices, the phasors approximate the arc of a circle, as shown in red. We'll call the angle that this subtends 2α. Now 2α is also the phase difference between the first and the last phasor, which is 2πa sin θ/λ.
α = πa sin θ/λ.
The phasor sum has magnitude A, which we can write as R.sin α, where R is the radius of the arc formed by the phasor sum. On the axis, where the phasors are all in phase, the phasor sum is the straight line shown in red at right. This is the amplitude of the diffraction patter at θ /= 0, which we call A0. By the definition of angle, 2α = A0/R, which gives us R = A0/2α. So the magnitude of the phasor sum is
A = 2R.sin α = A0sin α /α.
As we've seen in several previous chapters, the intensity I is proportional to square of the amplitude A. So, using
I0 for the intensity at the centre of the pattern, we have
I = I0(sin α /α)2
where
α = πa sin θ/λ.
Graphing I(θ) with the phasor sum
The animated phasor diagram (left); the plot of I(θ) and, below it on the same scale, the resulting diffraction pattern. The vertical black line scanning across the graph is in step with the phasor diagram.
As we remarked when looking at the intenstiy of Young's experiement in Interference, the eye does not respond linearly to intensity. To my eyes, at least, the difference in brightness seems much less than the difference in the intensity graph.
Varying the slit width
A slit with variable width. As the sit is narrowed, the pattern expands.
DIffraction effects are most noticeable when the slit with a is not very much larger than the wavelength λ. This apparatus allows us to vary the slit width, but the pattern is still projected on a distant screen to make the diffraction effects cl
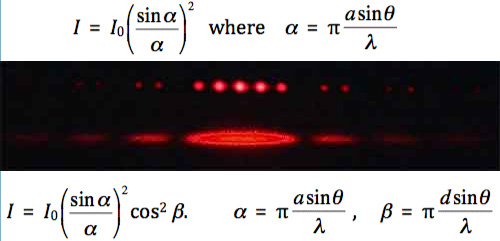
Young's experiment with finite slit width.
Top: a Young's experiment with slit separation d and slit width a. Bottom: a single slit diffraction pattern with the same slit width a.
In the Young's experiment in Interference, we didn't mention the effect of finite slit width. From the equations above, we can see that, if d is an integral number of times the slit width (d = na), then the nth interference fringe is absent: neither slit radiates power at this angle so there are no rays for constructive interference.
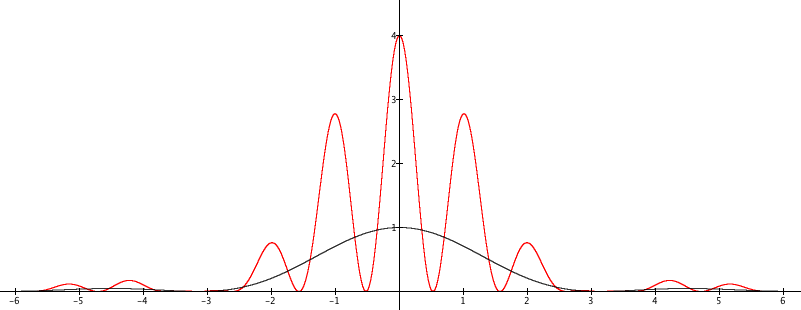
In black: the calculated diffraction pattern due to a single slit of width a. (The lower pattern in the preceding photo) In red, the calculated combined interference pattern due to two slits of width a and centre-centre separation d = 3a. (The upper patter in the preceding photo.)
Note that the envelope for the interference pattern has four times the magnitude of the diffraction pattern for a single slit. The integral of the combined interference pattern (the area under the red curve) must be twice the integral of diffraction pattern (the area under the black curve), because two slits admit twice as much light, so its maximum must be four times the maximum of the diffraction pattern. We show this experimentally in Interference with single photons. (In the photograph above, it's hard to see by eye that the factor is four. However, note that the interference peaks are white, because of extreme saturation of the camera.)
Further reading.
This page supports the multimedia tutorial Diffraction.