Frequency and pitch, amplitude, intensity and loudness, envelope, spectrum and timbre: how are they related? This support page to the multimedia chapter Sound is the first in a series giving more details on these sometimes subtle relationships.
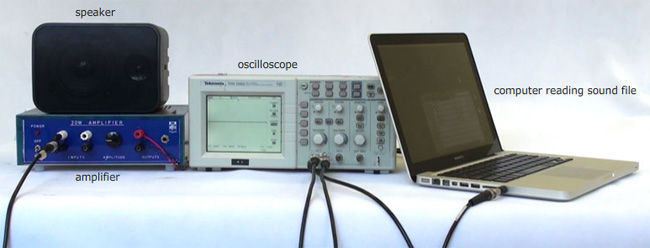
Many of our sound samples have been generated by computer, as shown below. An explicit equation for the desired sound wave (amplitude as a function of time) is evaluated and converted by the computer’s sound card to voltage as a function of time, V(t). This is input to an oscilloscope, which converts V(t) to a y(x) display.
When preparing these examples, these are also output to a power amplifier and loudspeaker, as shown here. When you use them, you will download the numerical signal and this time your computer’s sound card will convert it to V(t), amplify it and output it to headphones or speakers. This and subsequent sections will probably work rather better with headphones than speakers, especially tiny computer speakers.
Frequency and pitch
In this example, the signal is a sine wave. Its frequency is initially 440 Hz. It then increases over time to 880 Hz and maintains that frequency. The amplitude remains constant throughout. If you are using computer speakers, you should turn the volume down considerably to avoid distortion (and possible damage to the speakers). Now, what did you hear? You probably heard the pitch increase considerably. You probably also noticed that the sound became louder: apart from any effects due to peculiarities in your amplifier and headphones/speakers, this is expected because human ears are rather more sensitive at 880 Hz than at 440 Hz. You may also have heard rattles and distortion due to your speakers, especially if they are the small type usually used in computers.
By international agreement*, 440 Hz is the standard pitch for the musical note A4, or A above middle C. This note is used to tune orchestras, chiefly because it is an open string on violins and violas, and is an octave and three octaves respectively above open strings on the cellos and basses.) 880 Hz is the note A5, one octave above A4. In much Western music, the scales from which tunes are made have the property that the eighth note in the scale has double the frequency of the first. 'Oct' is the prefix for eight, hence octave. So increasing frequency increases pitch and a doubling of the frequency is an increase of one octave. For notes that are not too high (including these) increasing the frequency also increases the loudness, as mentioned above, and as discussed in more detail in another page. You’ll possibly also find that the timbre changes. So frequency has a big effect on pitch, but also affects loudness and timbre.
* This agreement is not universal. In the past, the tuning varied both with time and geographical location. In orchestras, there has a tendency for the frequency of A to rise.
Most of us agree that changing the frequency by a given proportion gives the same pitch change, no matter what is the start frequency. For more about pitch, frequency and wavelengths, go to Frequency and pitch of sound.
Amplitude, intensity and loudness
Here the signal has a frequency of 440 Hz throughout, but the amplitude increases by a factor of two. Later we'll show that that is an increase in sound level of 6 dB.You will notice a modest increase in loudness. You may also notice changes (probably small) in pitch and timbre. We’ll leave a detailed discussion of how amplitude affects intensity and loudness for another page.
Envelope, spectrum and timbre
All the other perceptual properties of a sound are collected together in timbre, which is defined negatively: if two different sounds have the same pitch and loudness, then by definition they have different timbres. Here are six musical notes. The pitch is almost constant (‘almost’ because it’s hard to pick up a new, cold instrument and play it perfectly in tune) and the loudness is approximately constant, too. (What does it mean to say that a bell note, which dies away gradually, is as loud as a sustained violin note?) So these sounds all have different timbres, which is how we can tell that they come from different instruments.
The top graph is the microphone signal (proportional to the sound pressure) as a function of time. Notice the substantial differences here. The orchestral bell and the guitar share the property that they reach their maximum amplitude almost immediately (when struck and plucked, respectively). No more energy is put into them, and energy is continuously lost as sound is radiated (and much more is lost due to internal losses), so the amplitude decreases with time. Of the others, the bassoon has the next fastest attack: it reaches its maximum amplitude rather quickly. We should add that, for the wind instruments and violin, the rapidity of the start depends on the details of how one plays a note. Nevertheless, the faster start of the bassoon is typical. This series shows us that the envelope is very important in determining the timbre.
Another contribution to timbre comes from the spectrum, which is the distribution of amplitude (or power or intensity) as a function of frequency. This is shown in the lower graph. With the exception of the bell, the spectra all show a series of equally spaced narrow peaks, which we call harmonics, about which more later. Note that the spectra are different, particularly at high frequencies. The spectrum contributes to the timbre, but usually to a lesser extent than the envelope.
Relations between physical and perceptual quantities
This animation summarises graphically the above discussion. Roll the mouse over quantities on the left to see (very approximately) the relative magnitudes of their effects on the quantities at right.