| |
|
|
|
1. Single slit diffraction of light. Commercial slides are available with a range of single slit dimensions. It is also possible to buy adjustable slits.
WARNING: Never look directly at a laser pointer, or shine it at someone else. Also be careful about 'specular' reflections; i.e. those from mirror–like surfaces.
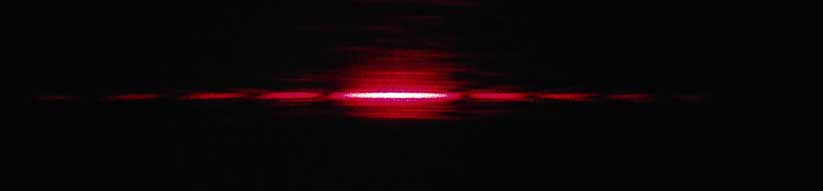
The two utility knife blades are clipped together with a small gap between their edges. The above photo was taken before the shiny surfaces were blackened with a marker pen. The spacing between the blades can be set by placing a suitable very thin object(s) between them and carefully closing them upon the object; care must be taken not to cut or indent the thin object and also to keep the edges of the two blades in the same plane so they don't overlap. If sufficiently small, the object can be left in place, or otherwise carefully removed. Different spacings can be made by using multiple layers of an object. I deliberately did not use a magnifier or microscope, but they can help in ensuring that the edges of the slit are parallel, i.e. the slit has a uniform width, and that the spacing is the same as the width of the object used to set the spacing. If the edges are not parallel, the resulting diffraction pattern will be different for different regions of the slit. Possible thin objects to set the spacing include: For the photographs below I used a set of Feeler gauges – these are sets of very thin metal used to set mechanical tolerances precisely – a set of 30 with thicknesses ranging from about 0.04 to 0.8 mm typically costs less than $A10 in hardware or automotive shops. The beam from a laser pointer was pointed at the slit so it produced the diffraction pattern on a convenient wall. The distance L from the slit to the wall was measured and to simplify measurements an intial photograph was taken with a ruler taped to the wall. The camera and slit should then not be moved, and the focal length of the camera lens should not be adjusted. Here are some examples of the diffraction patterns I photographed.
nominal slit width = 40 μm
nominal slit width = 55 μm
nominal slit width = 105 μm
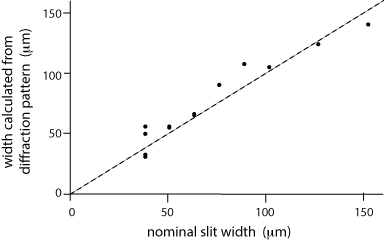
nominal slit width = 140 μm The mth minimum should subtend an angle θ given by a sinθ = mλ where λ denotes the wavelength and a denotes the width of the slit. The angle θ is sufficiently small so that the approximation sinθ = tanθ = θ is appropriate. The slit width a was then estimated by measuring the distance y between n adjacent minima by comparison with the photograph of the ruler. The following equation was then used a = nλL/y Here's plot of the nominal slit width (it is difficult to set the slit width accurately) and the slit width calculated from the measured diffraction pattern. If there were no errors in setting the slit width and in measuring the diffraction pattern the points would be expected to lie exactly on the dashed line.
If the diffraction pattern remains unchanged when the laser is directed at different parts of the slit, it indicates that the sides of the slit are reasonably parallel.
|
|---|
|
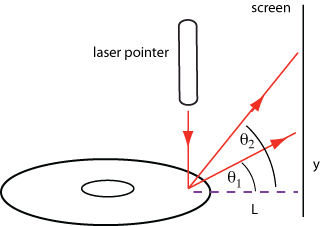
Transmission diffraction gratings involve a large number of very fine vertical lines. These would be very difficult to make at home. Luckily it is now possible to buy cheap plastic diffraction gratings; these are sometimes sold as sheets of material that can be used for various decorative purposes. The widespread use of CD's and DVD's that have repetitive structures with dimensions comparable to that of light also makes several experiments readily available. 2.1 The Compact Disc as a reflection grating. The compact disc records the audio information in digital form via a spiral sequence of shallow pits in the surface of the CD. The sequence depends upon the audio content, the error correcting algorithm and the modulating agorithm. Although the sequence will not in general be periodic, the pitch of the spiral, i.e. the distance between adjacent tracks, is the same for all CD's and equal to 1.6 μm.
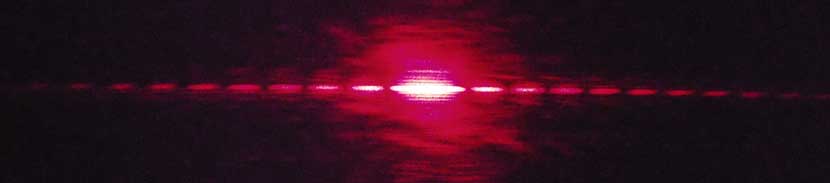
Maxima will be produced at a sinθ = mλ Experiments can be made performed using a red or a green laser pointer. A CD or a DVD (or even a minidisc) might be used. 2.2 The Compact Disc as a transmission grating If the reflective surface is removed from a compact disc, the remaining pattern of pits in the transparent plastic will produce maxima and minima . The label, and thus the reflective surface, can usually be removed from an unwanted CD by sticking adhesive tape to the surface and rapidly pulling it away. The light from a laser pointer can then be directed through this region as shown below. Usually I've found it works better towards the edge of the CD, you might have to experiment to find the best region.
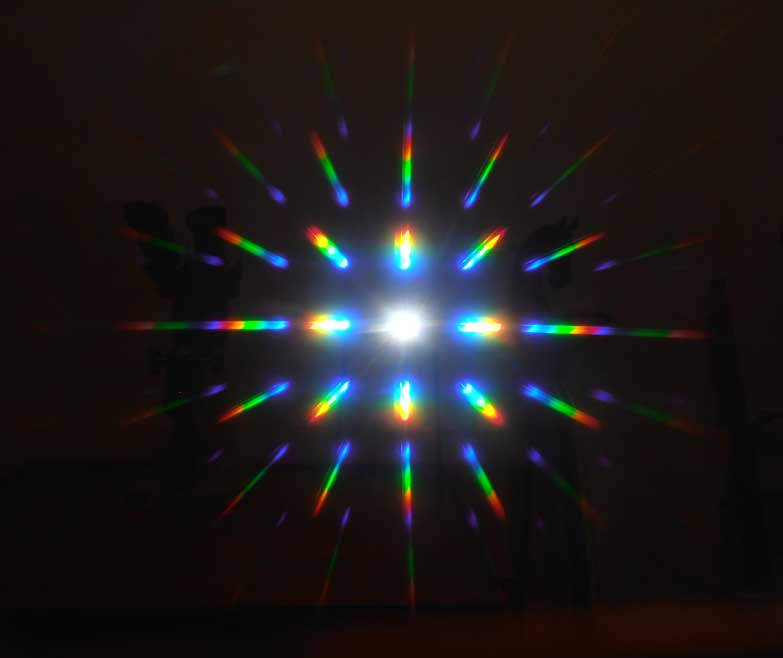
The photograph below shows an example. Maxima will be again be produced at a sinθ = mλ The distance between the screen and the CD was 400 mm. The values of y that I measured were 180 mm (m=1) and 540 mm (m=2) for the red laser and 140 mm (m=1) and 360 mm (m=2) for the green laser. Given that λ = 670 nm and λ = 532 nm for the red and green lasers respectively, these values correspond to track spacings of 1.63, 1.66, 1.61 and 1.59 μm respectively. These values are in reasonable agreement with the published value of track pitch (i.e. the distance between succesive tracks ) for a CD being 1.6 μm. 3.3 Two dimensional gratings. 3.3.1 'Firework' or 'Diffraction' glasses It is possible to make plastic diffraction gratings with both vertical and horizontal lines. They are often sold in cheap glasses that are designed to produce a spectacular display of colours when viewing multiple light sources, particularly fireworks. Here are two photos taken through a pair of these glasses.
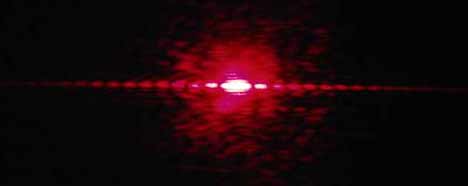
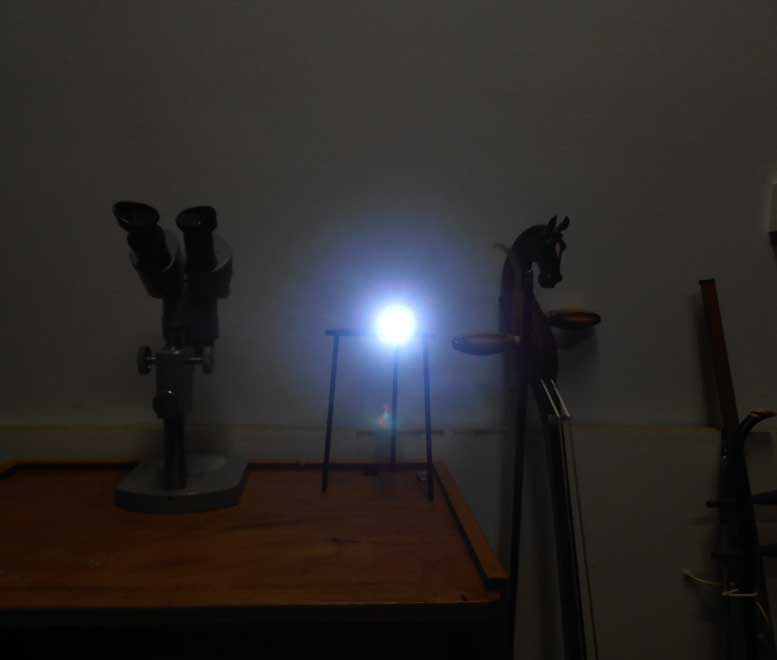
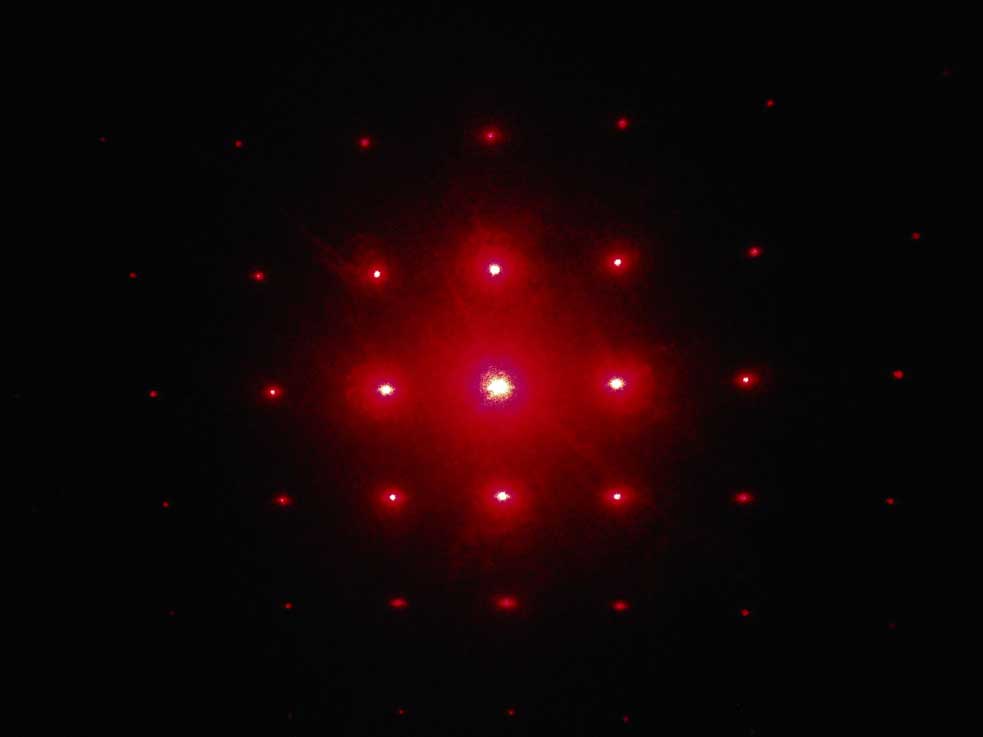
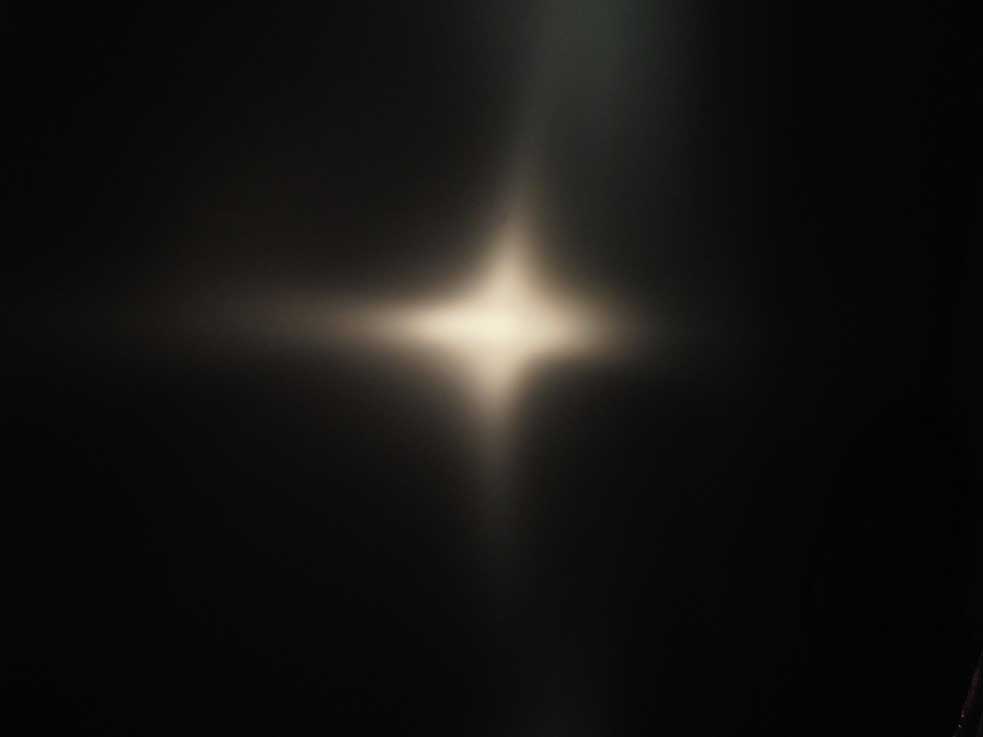
The photo on the left shows a torch in a darkened room. The photo on the right shows the same scene, but now photographed through one of these glasses with a 2D grating. The effect with a single light source is quite spectacular - the effect with multiple light sources such as occurs in a night scene in a city, or a fireworks display can be quite exhilarating. The photgraph below shows the effect of shining a laser pointer through a pair of these glasses.
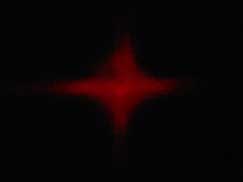
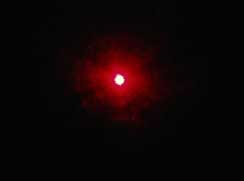
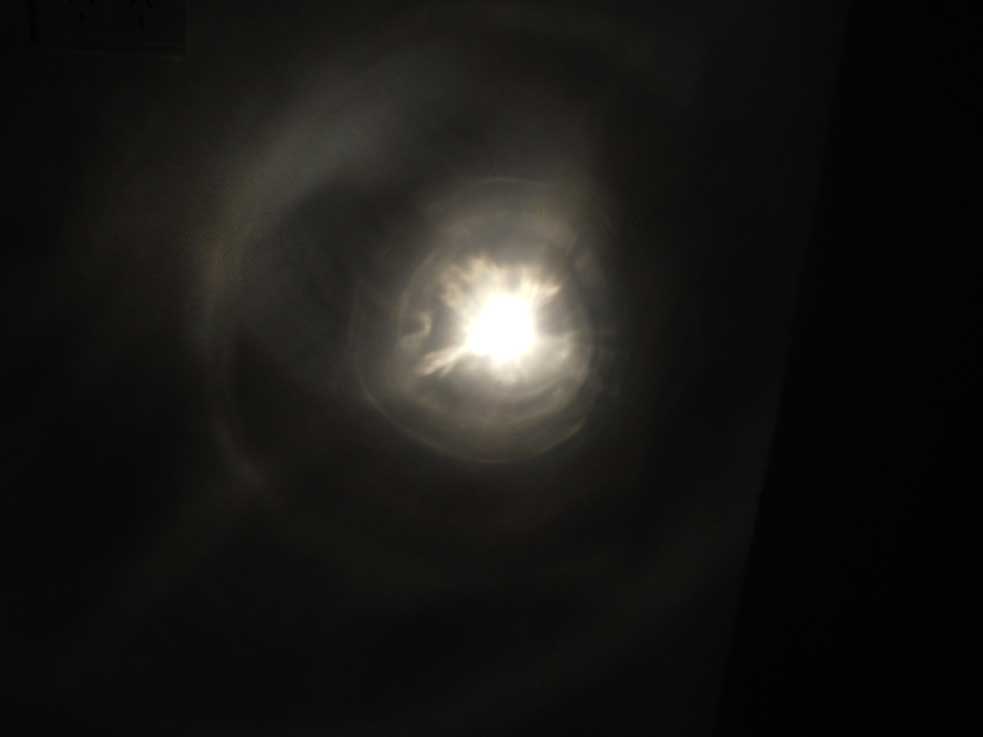
Measurements of the diffraction pattern indicate a spacing of 3.8 μm. 3.3.2 Fabrics In some fabrics the integral warp and weft can also act as 2-D grating because the threads are crossed at right angles. The spacings are rarely optimal, but a diffraction pattern can be clearly seen with some fabrics. The material for umbrellas is usually suitable. In the photos below, the effect of placing an umbrella in the light beam directed at a white wall is shown. Rotating the umbrella will cause the diffraction pattern also to rotate.
laser pointed at wall laser pointed through umbrella
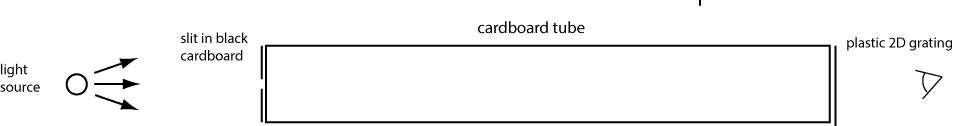
torch pointed at wall torch pointed through umbrella 3.4 Spectroscopy using a diffraction grating. If you have a single source of light in a dark room, then you can examine its spectra by simpling looking through a plastic 2D grating. However in many cases you will want to look at a specific region of a light source, often in an illuminated area. To this purpose it often worthwhile making a very simple spectroscope as shown in the figure below. The width of the slit will be a compromise; a wide slit will give a bright spectrum with reduced resolution, a narrow slit will produce a faint spectrum with improved resolution.
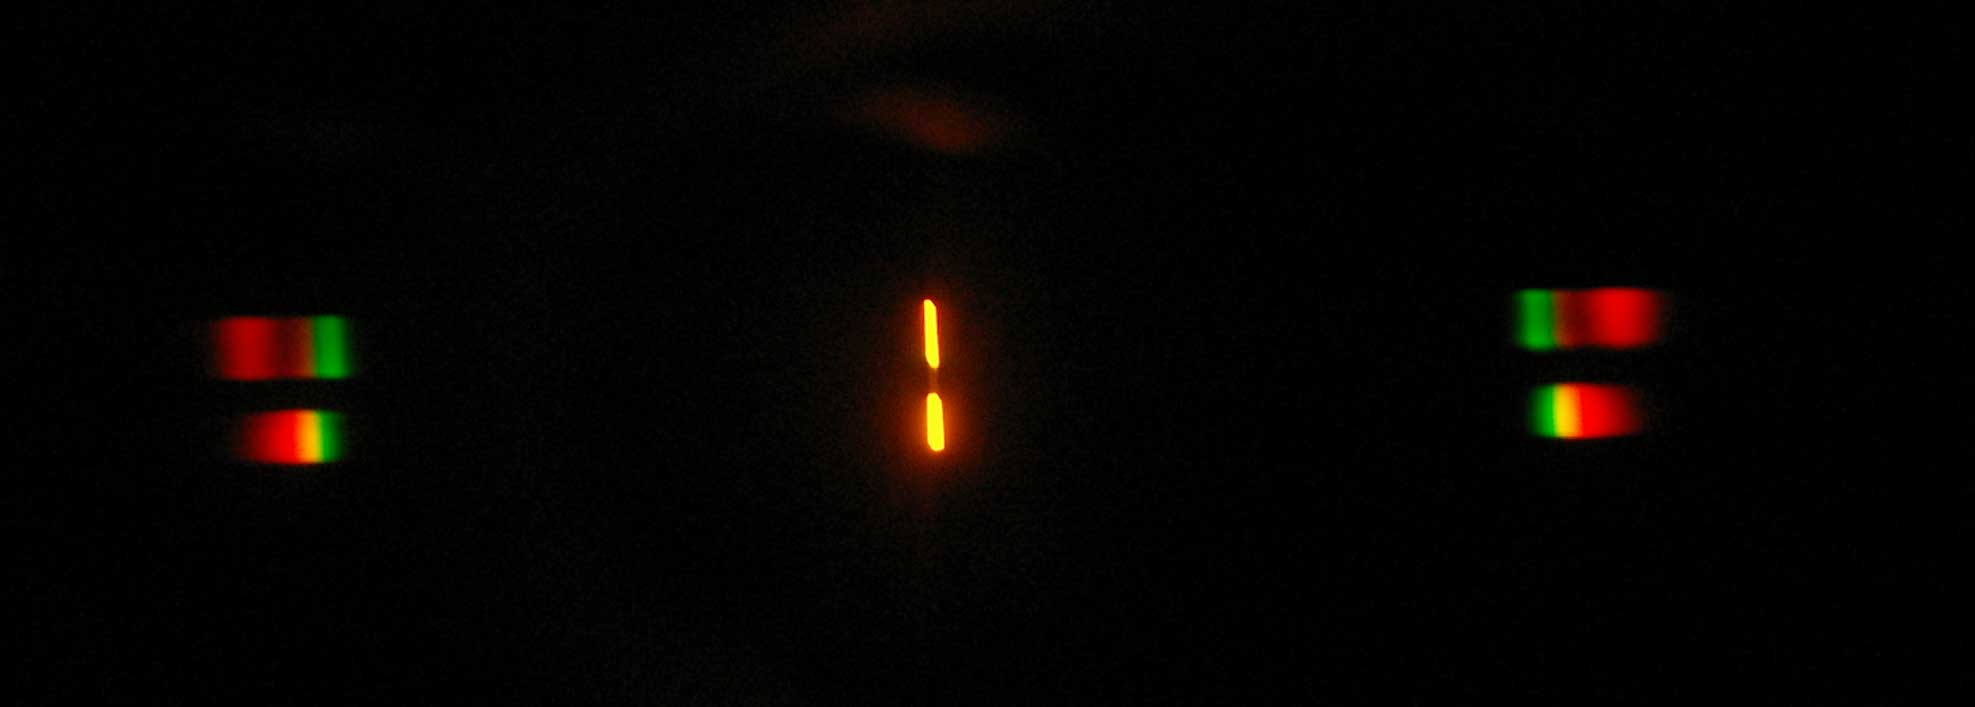
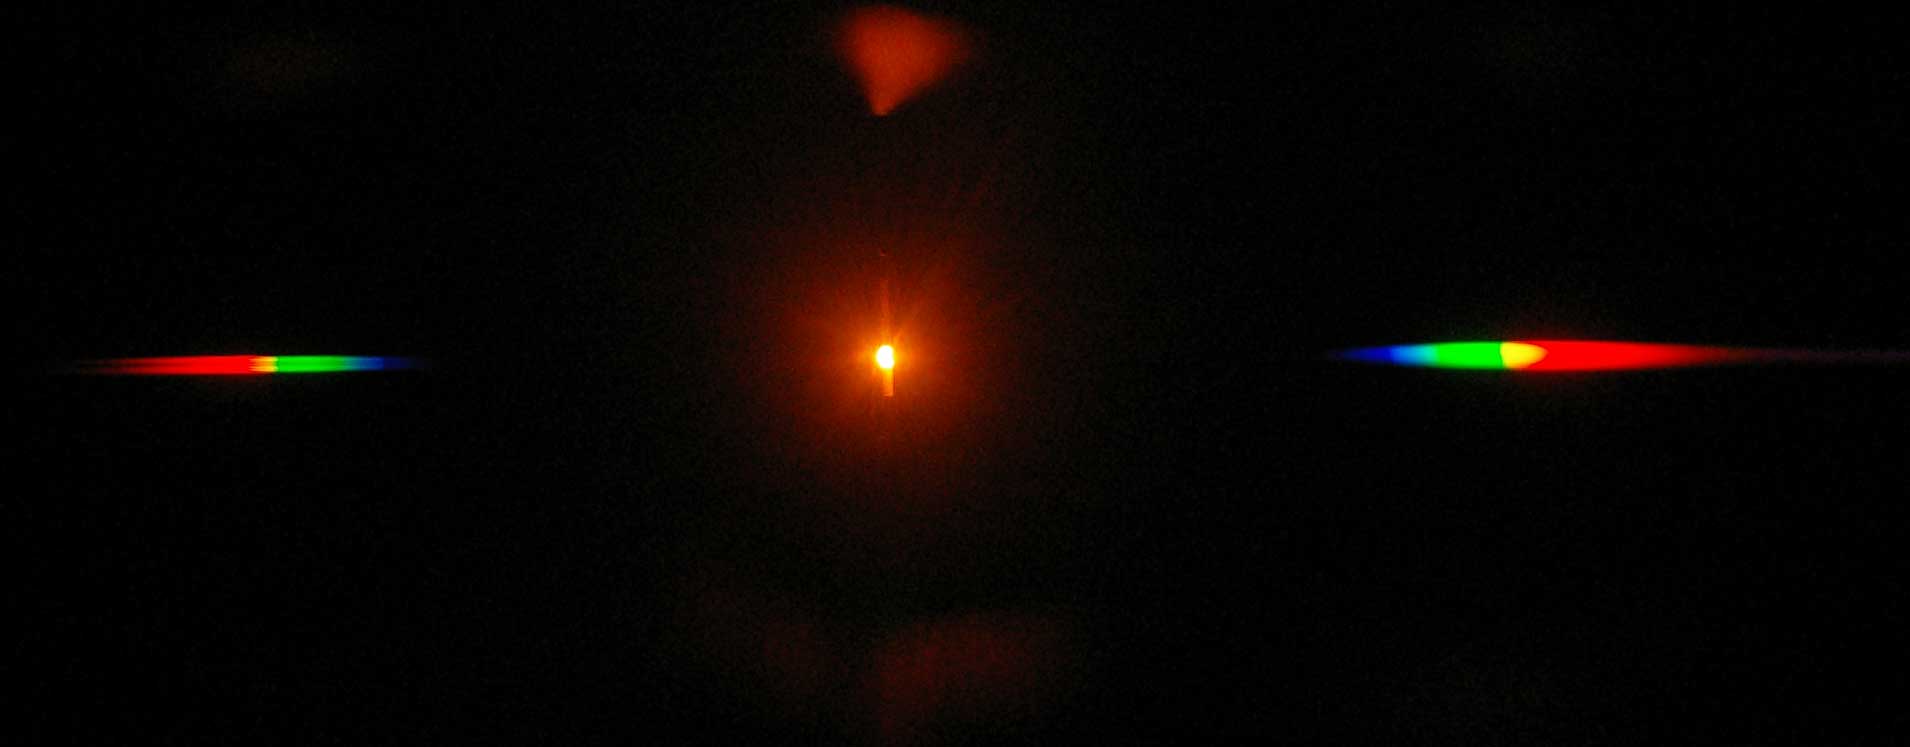
For simplicity, I have only shown the first order horizontal spectra in the photos below. 3.4.1 Spectra of sources of yellow light The photo below shows the spectrum of two LED. The lower one is a yellow LED with peak λ around 587 nm. The upper is a combined red/green LED that has an individual red and green LED connected with reverse polarity. When driven by an alternating voltage, the red and green LED will flash alternately. If this occurs more rapidly than the photoreceptors in your eye can respond, you will see the average of the two light sources, i.e. yellow. Although their images in the central slit both appear yellow, their spectra can be seen to be quite different.
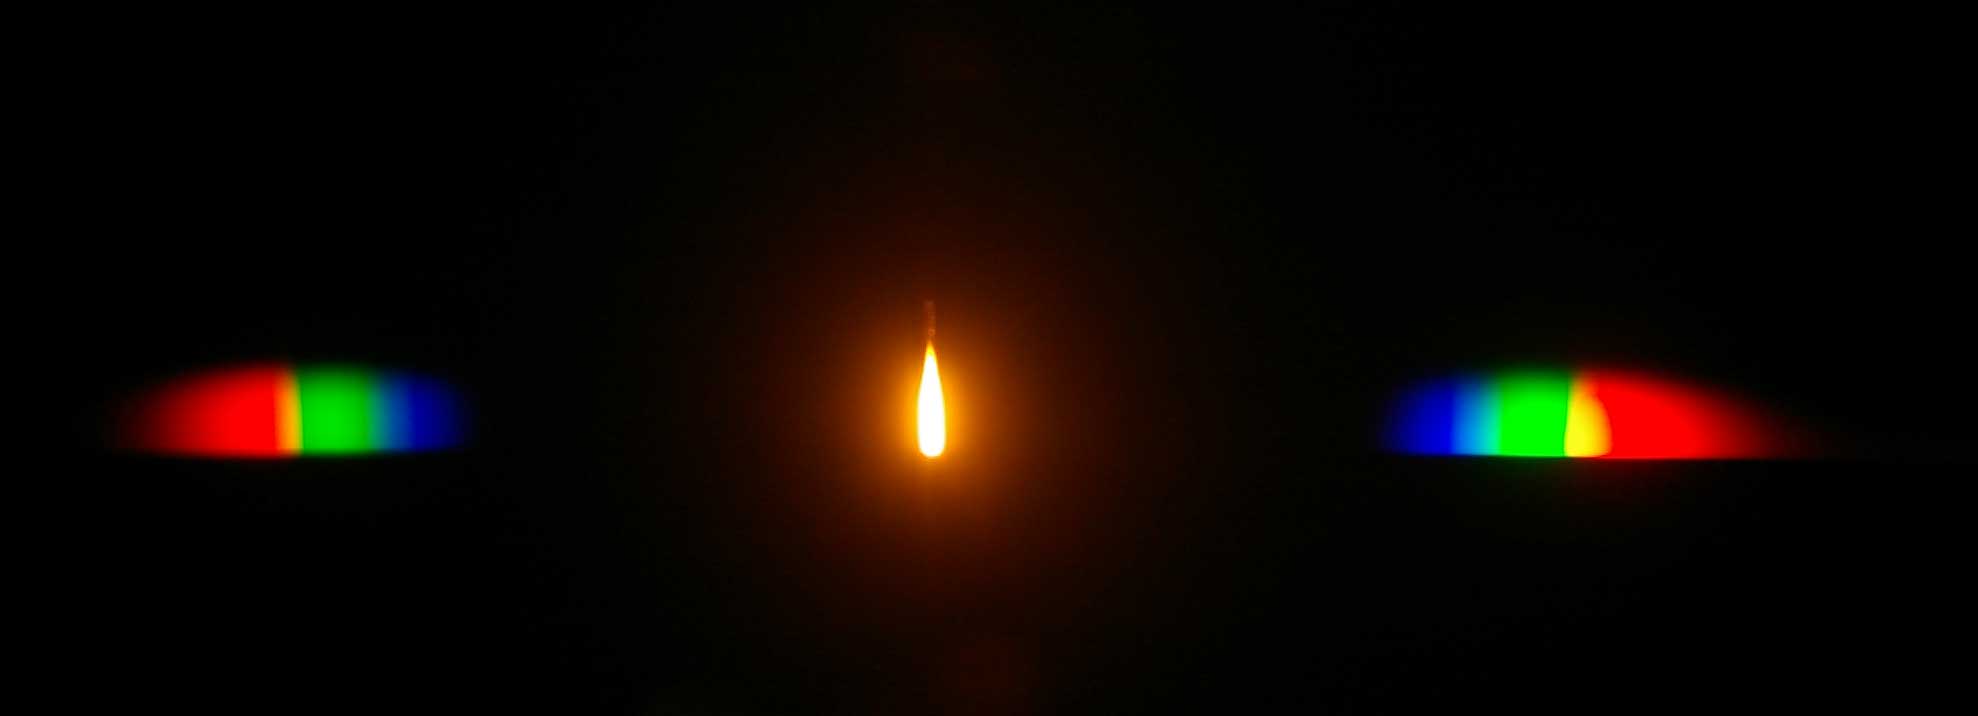
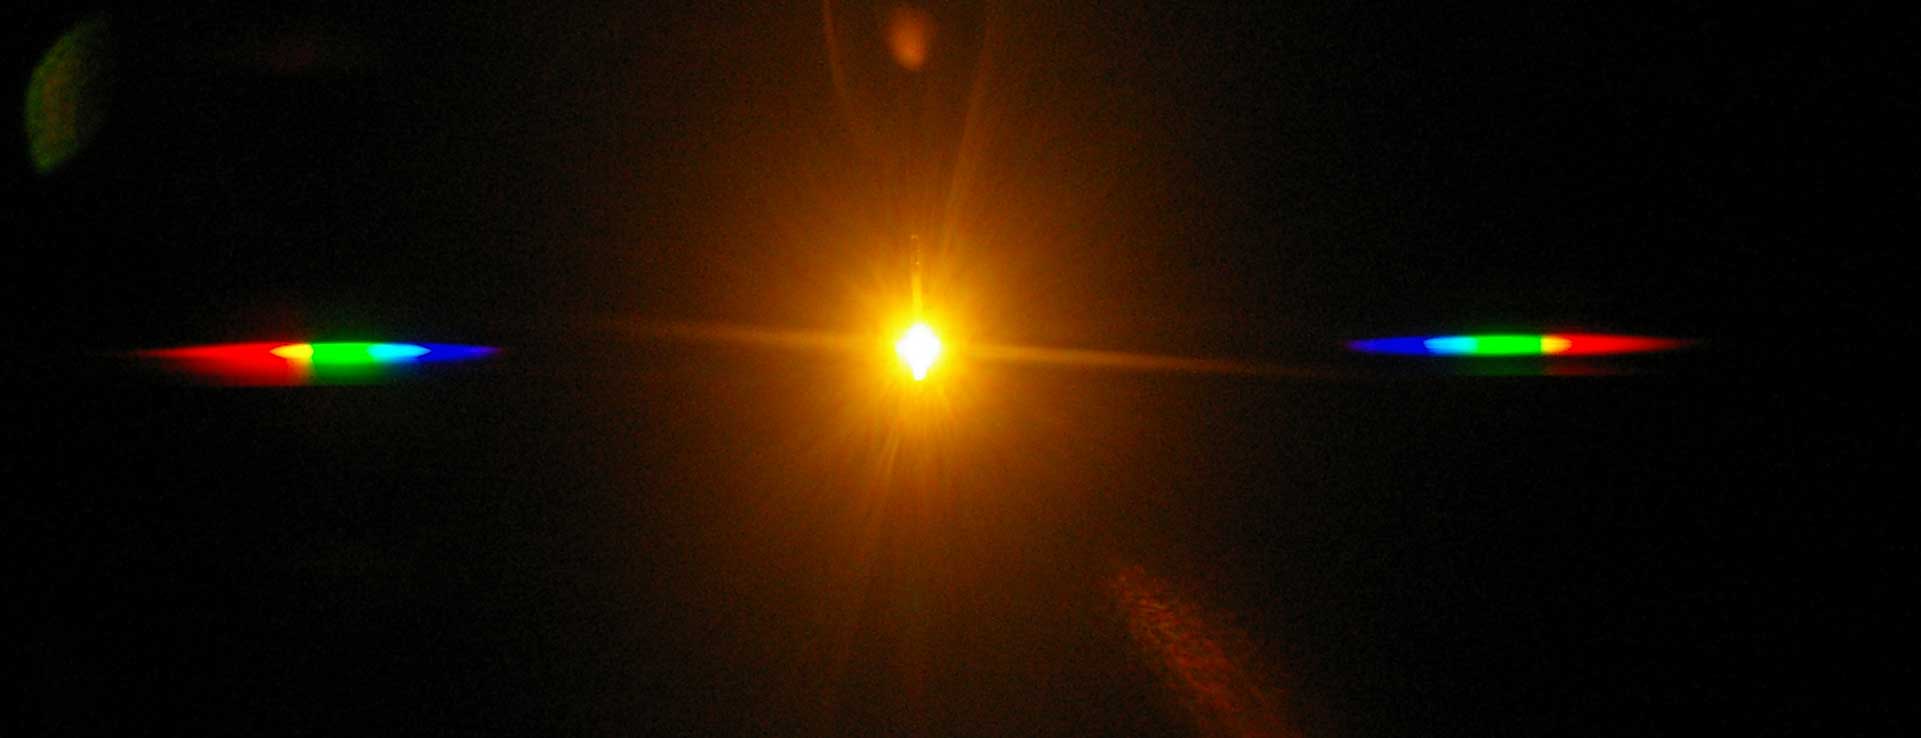
The photo below shows the spectrum of a candle flame. In this case the yellow colour is producing by glowing particles of carbon that produce classic black body radiation. (The candle flickered noticeably during the one second exposure required for this photo. hence the overlap of colours in the spectrum).
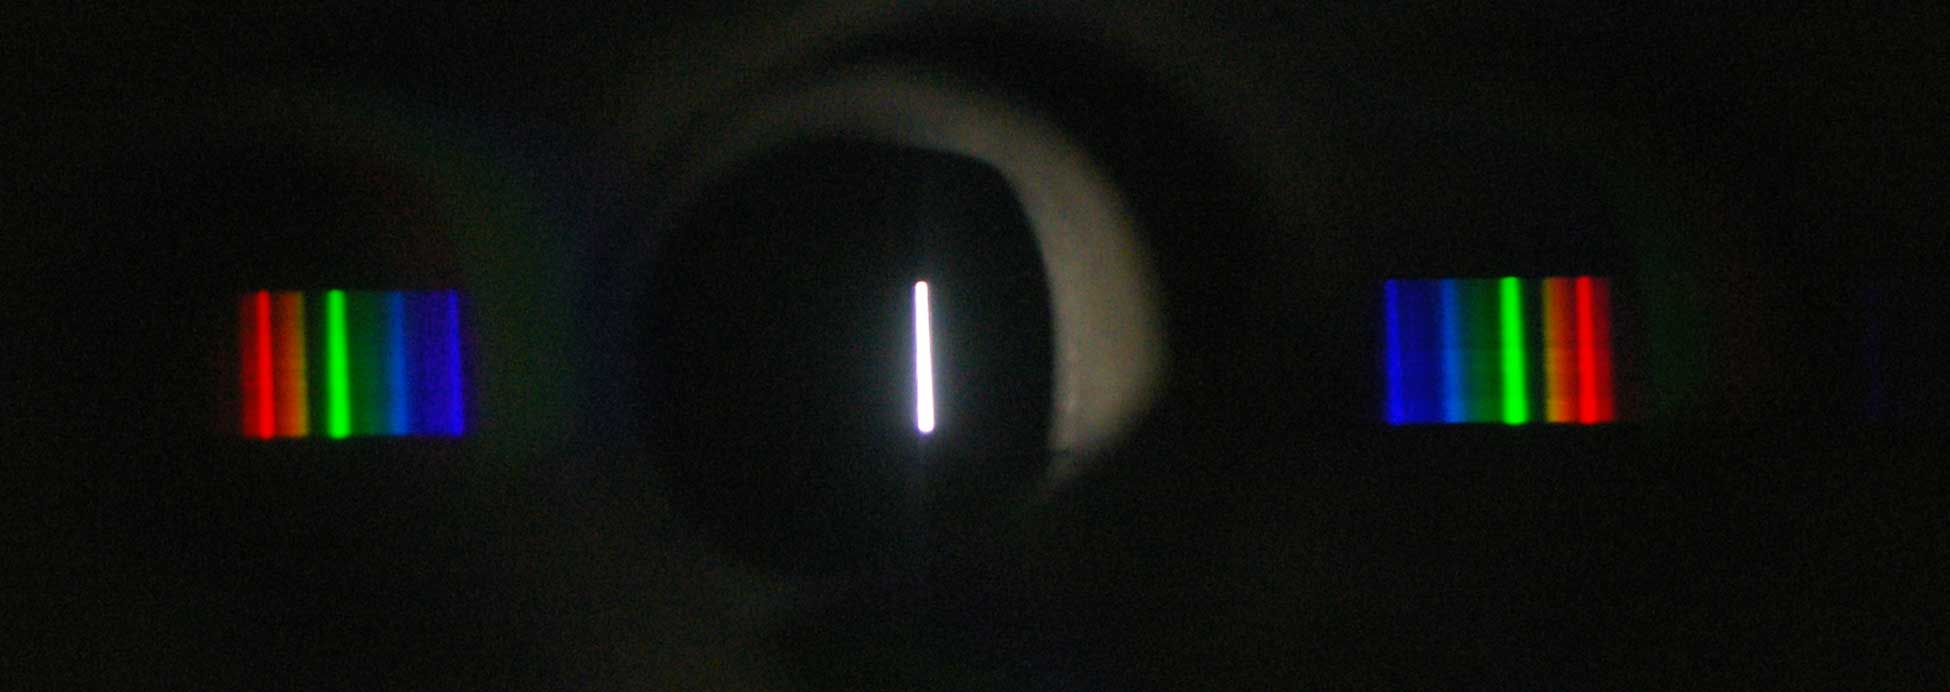
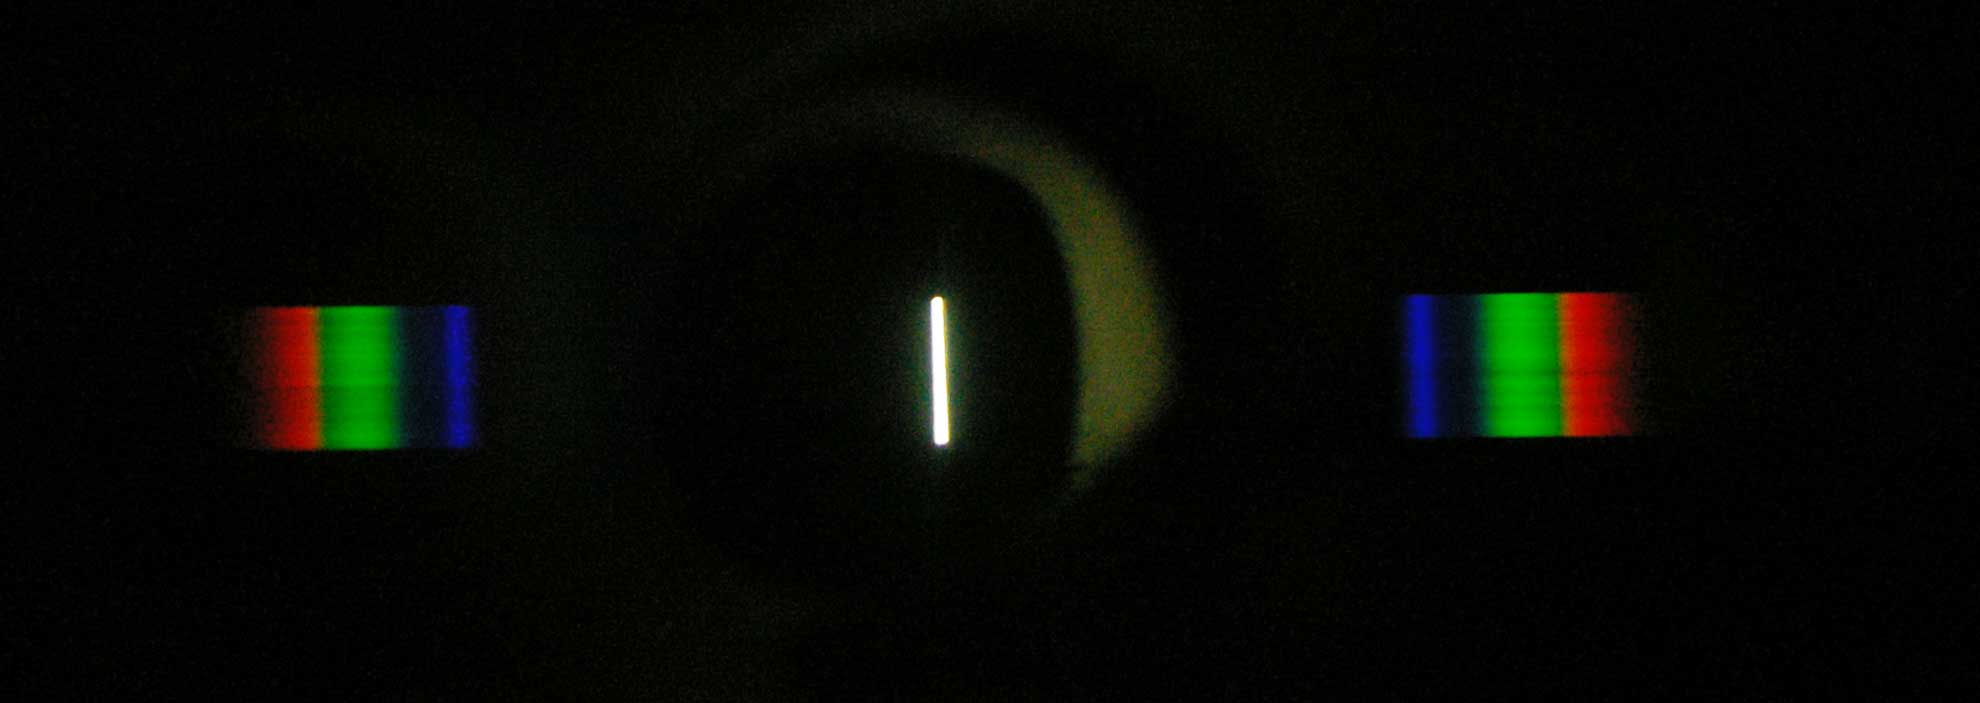
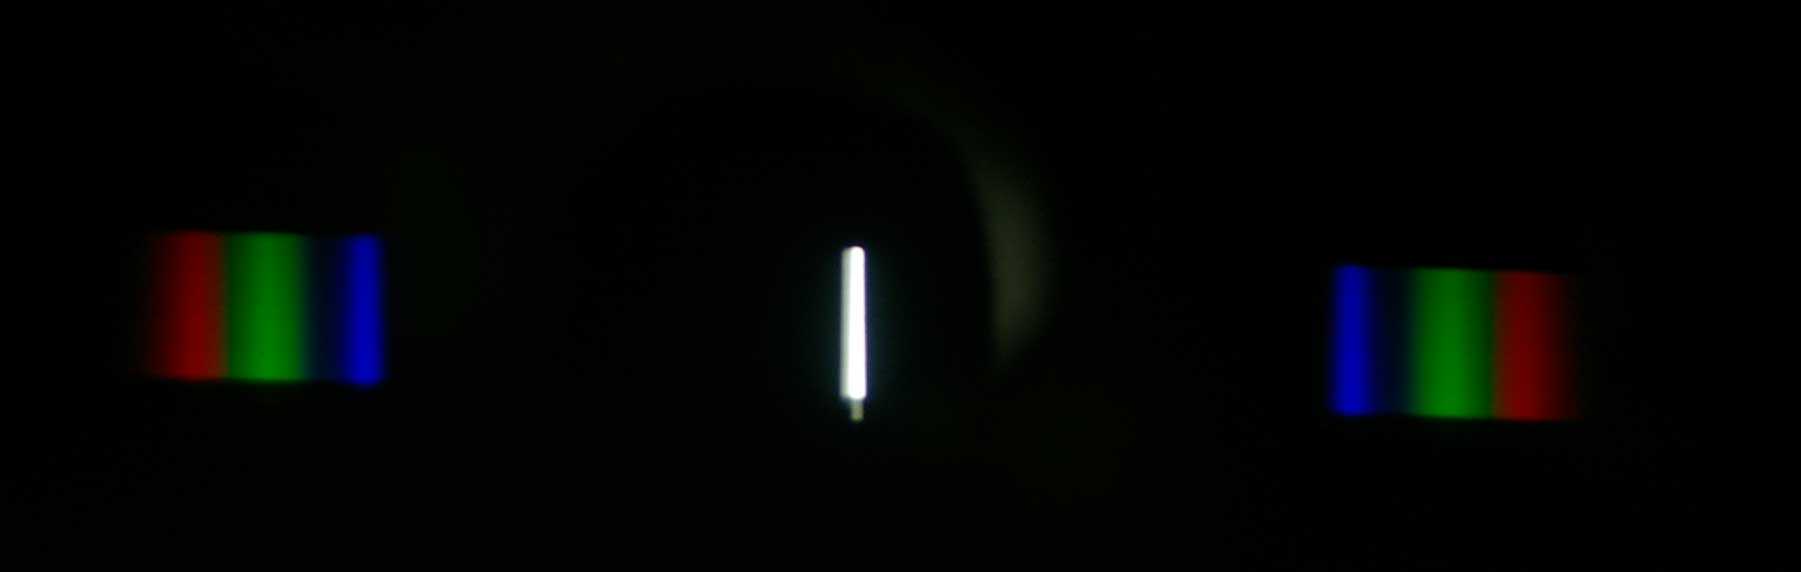
3.4.2 Spectra of souurces of white light The photo below shows the spectrum of a high efficency flourescent bulb.
The photo below shows the spectrum of a white LED bulb.
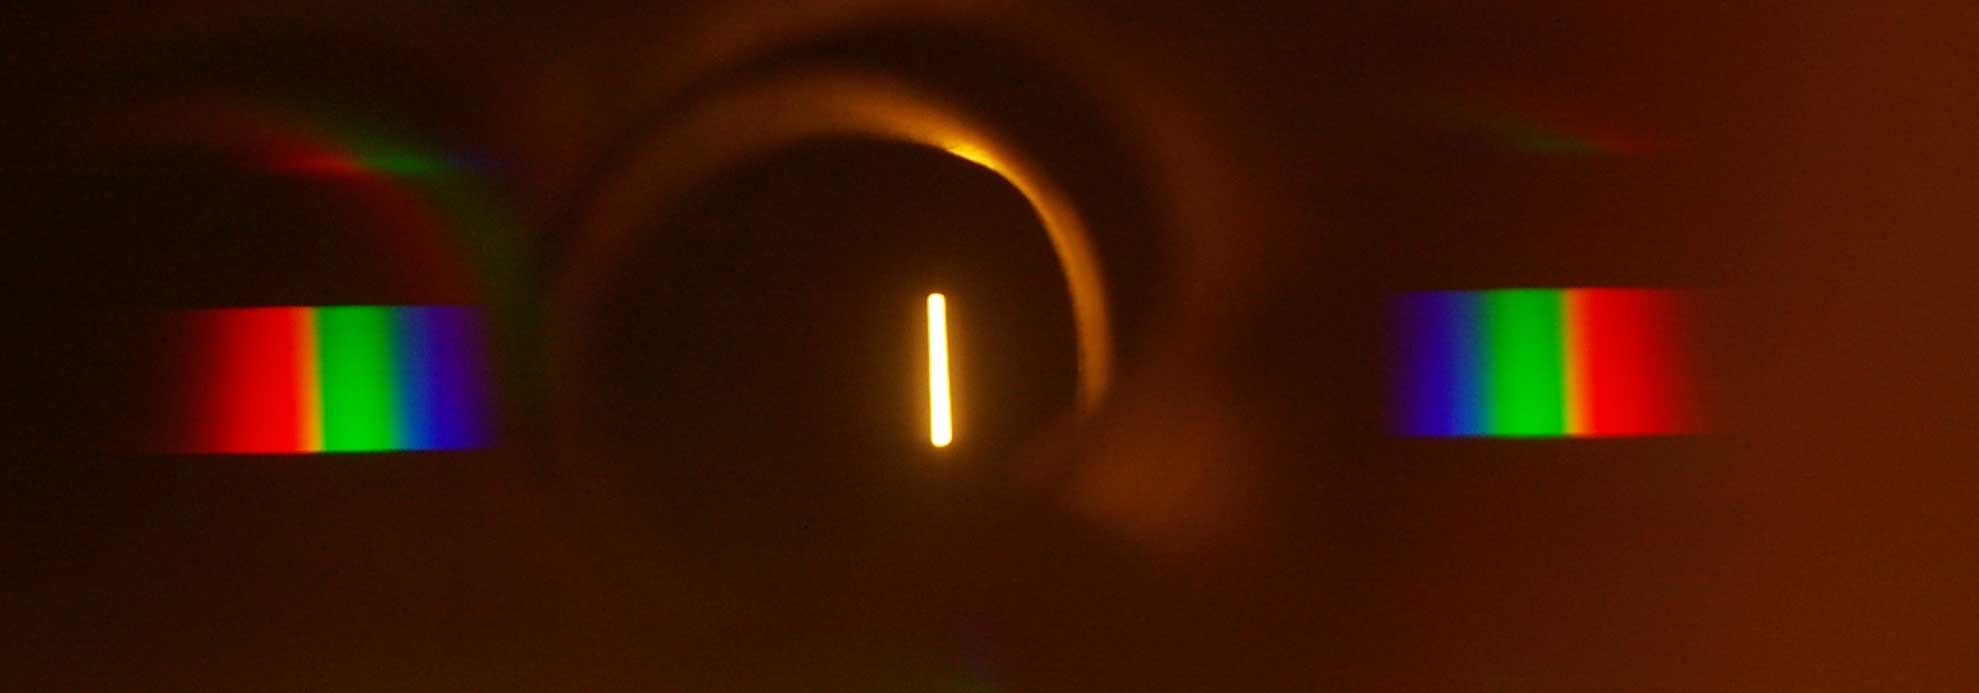
The photo below shows the spectrum of a conventional incandescent bulb, showing the continupous spectrum of black body radiation.
In the above photos, some light can be seen reflected along the inside of the cardboard tube. Next time I might spray it with flat black paint.
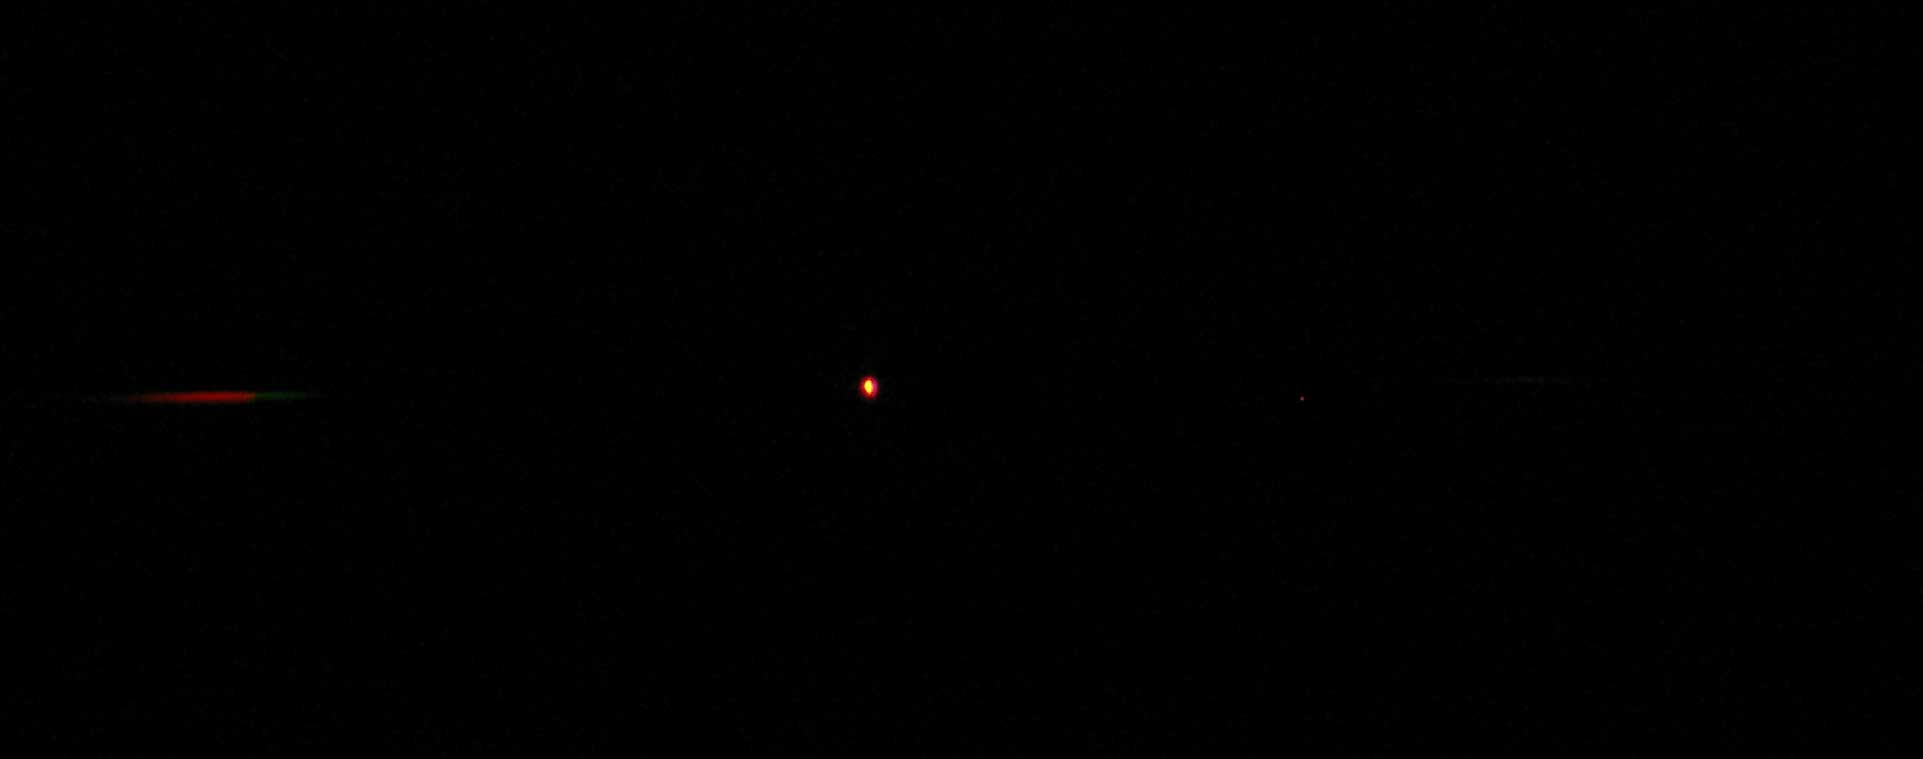
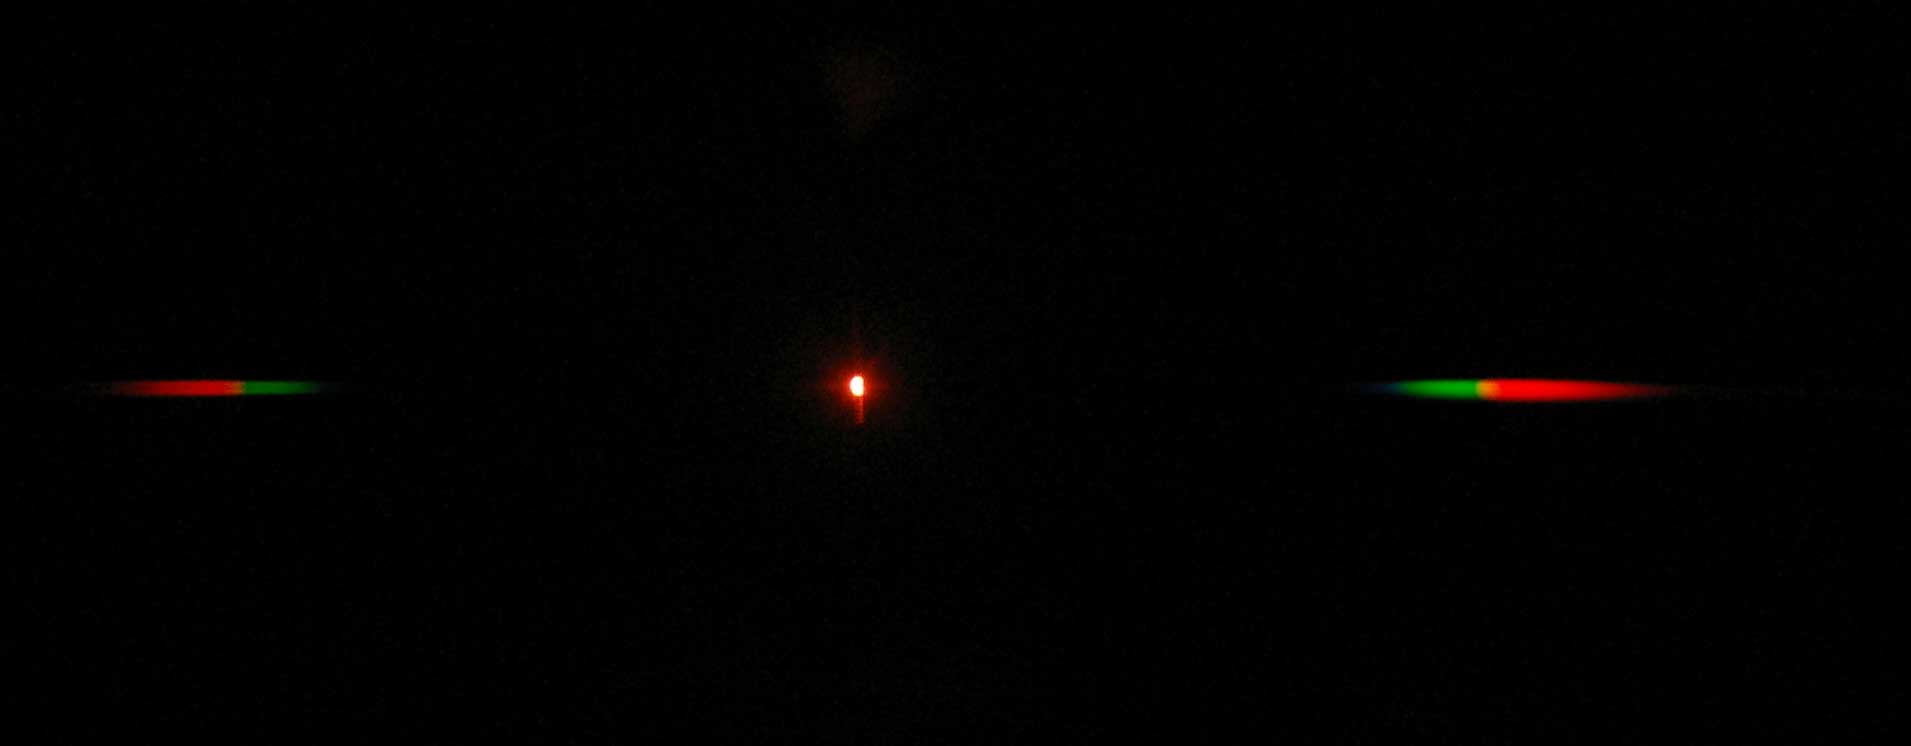
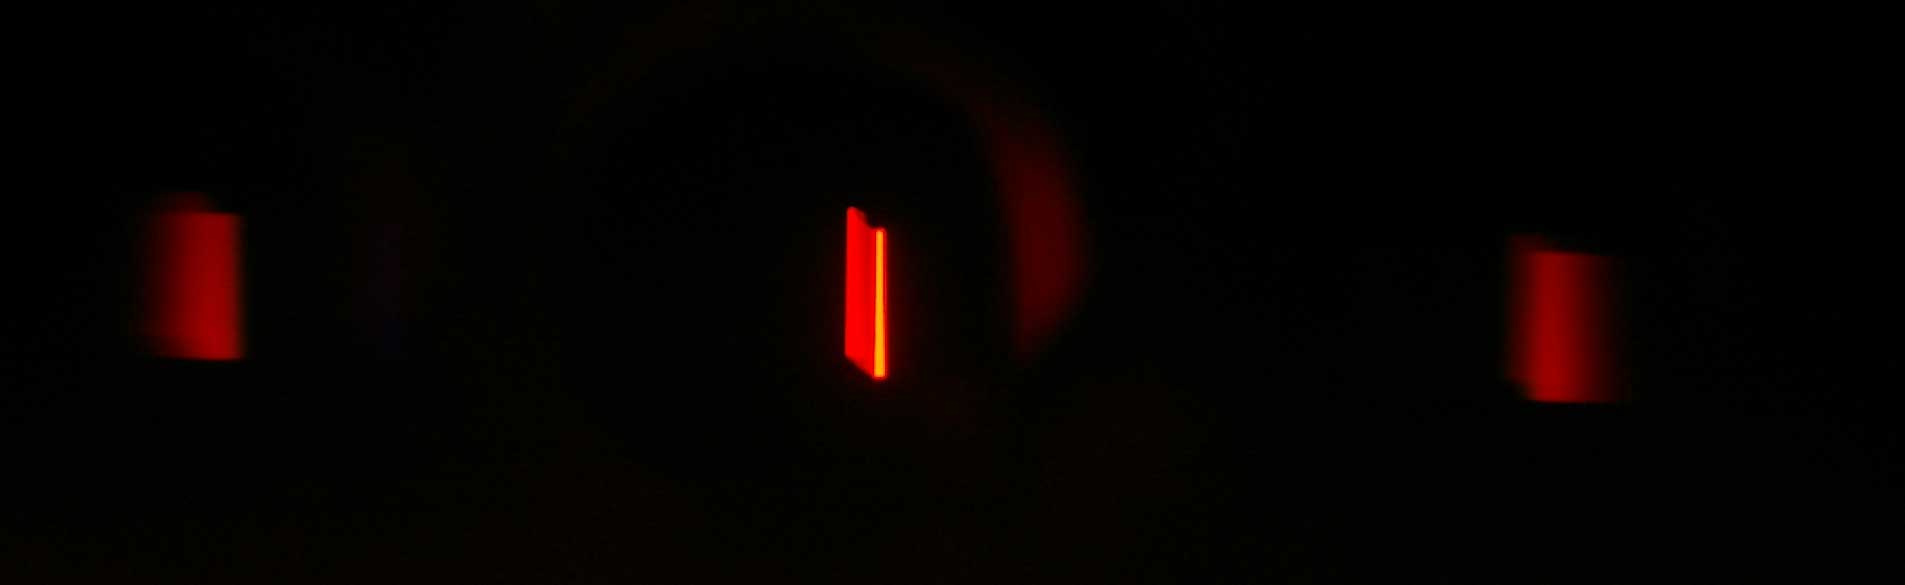
3.4.3 Spectral changes with increasing temperature The sequence of 4 photos below show the spectral changes produced by increasing the temperature of a torch bulb by increasing its voltage.
3.4.3 Spectra of colours on an LCD computer screen. Here I have directed the slit of the spectroscope to different regions on a computer screen. The photo below shows the spectrum of white on the screen.
The photo below shows the spectrum of red.
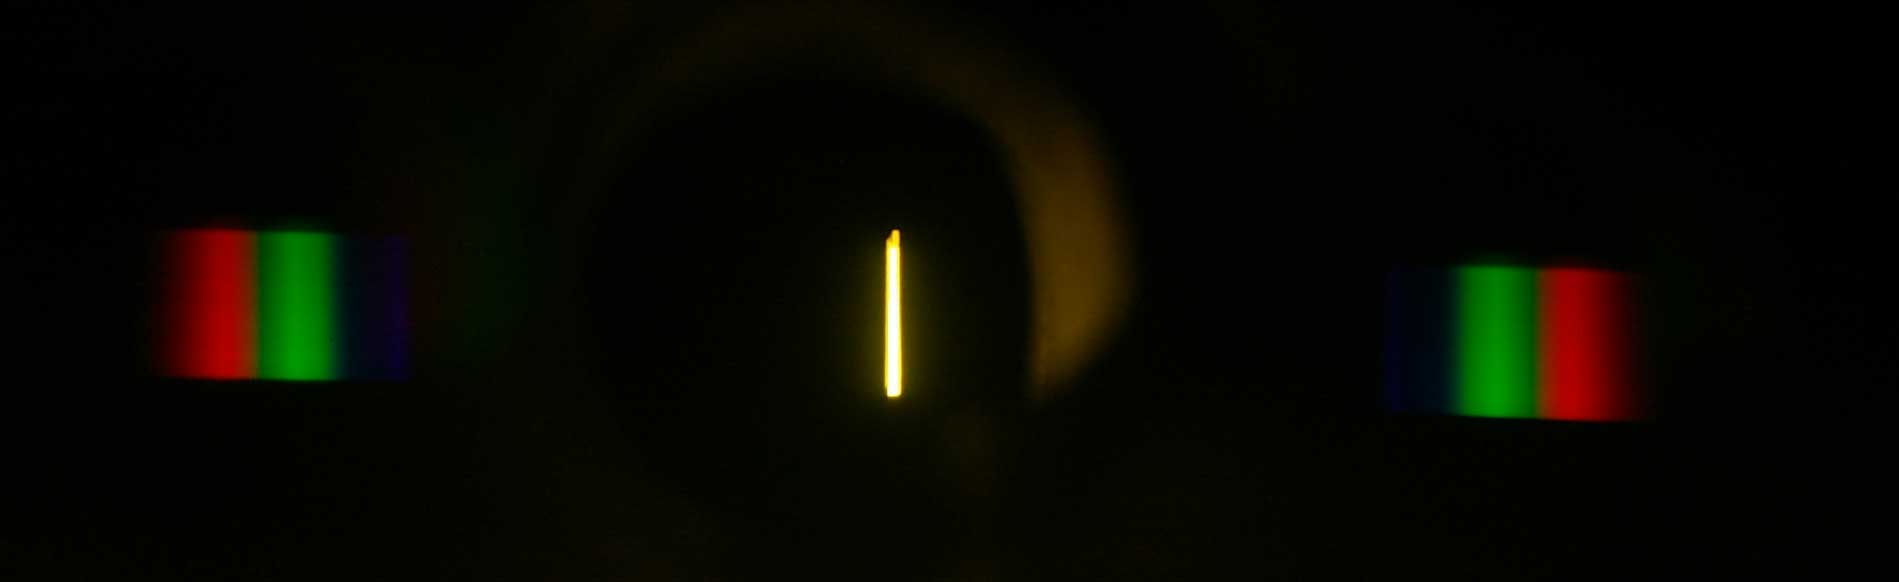
The photo below shows the spectrum of yellow.
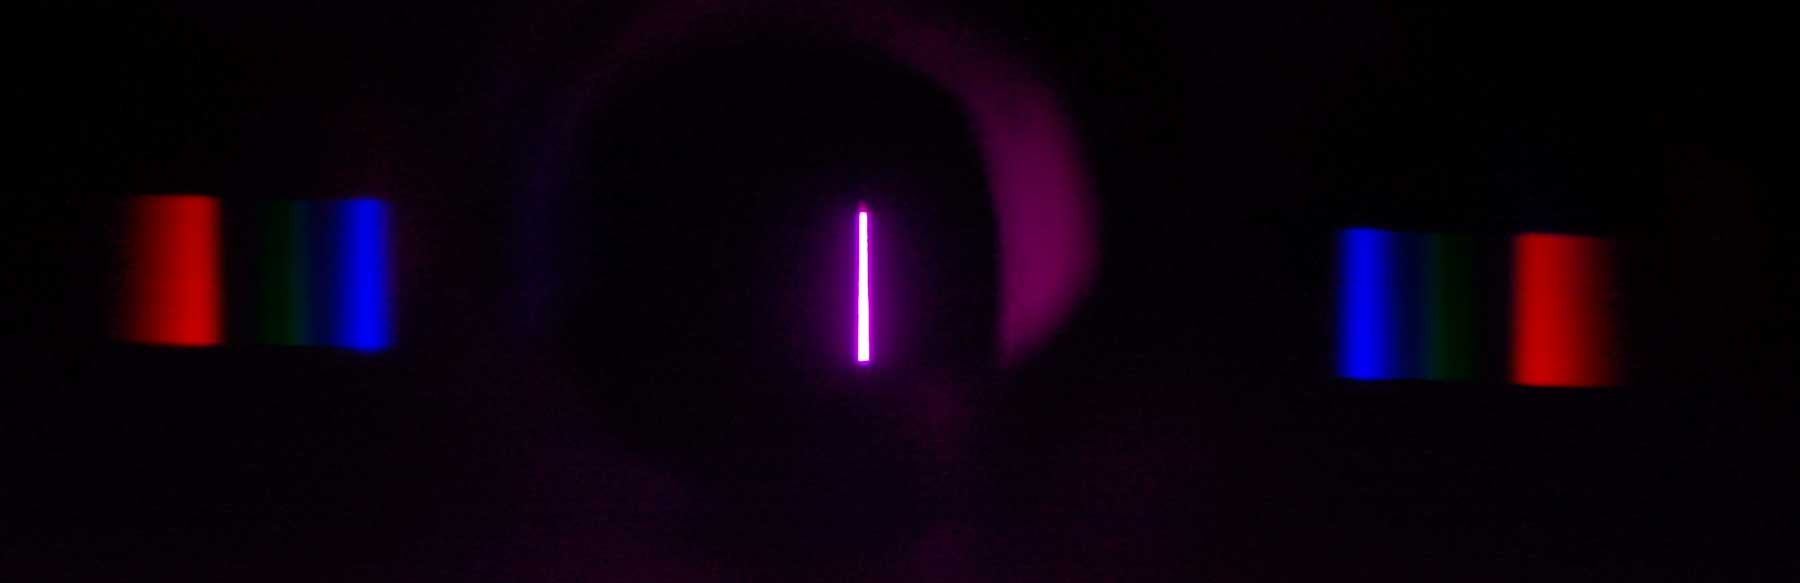
The photo below shows the spectrum of magenta.
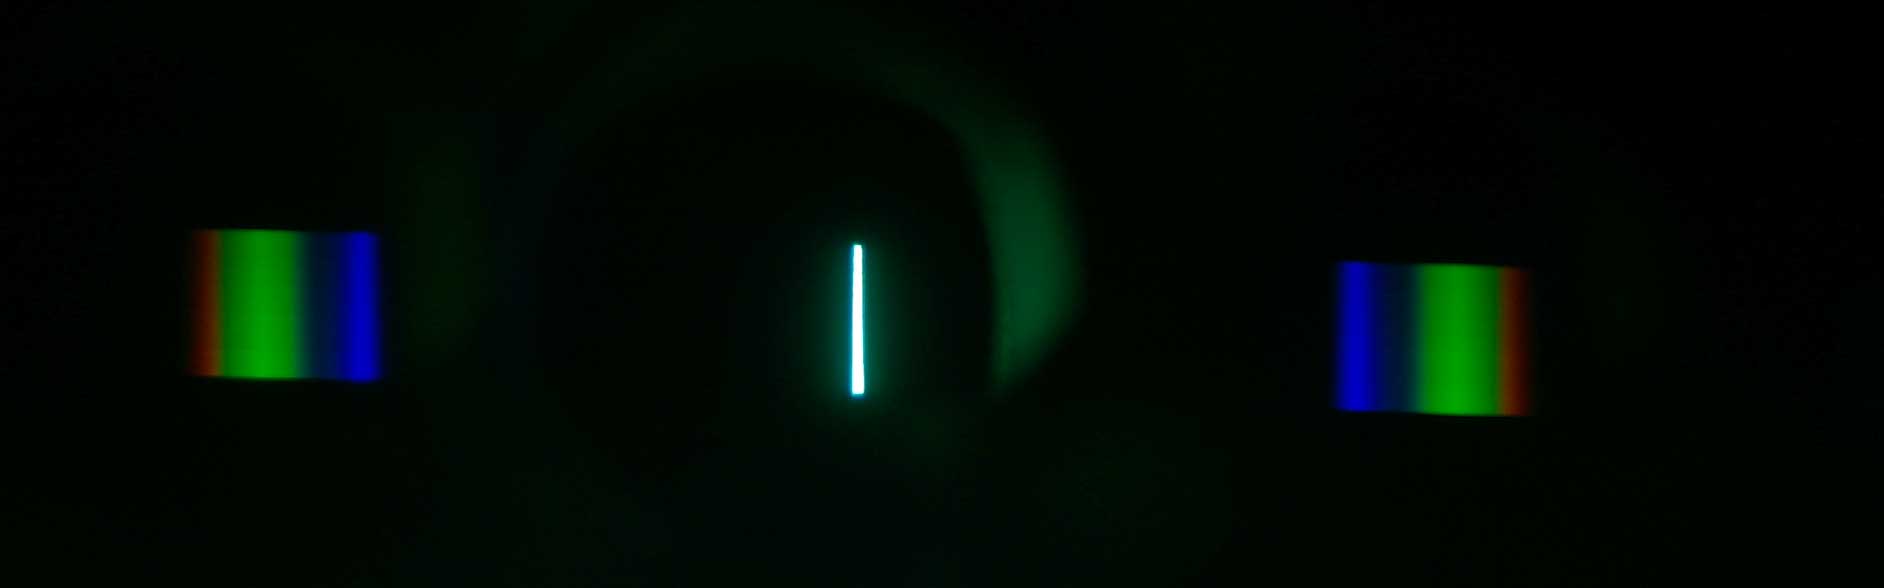
The photo below shows the spectrum of cyan.
|
|---|
|
||||||||