
|
|
|
Analysing video material using frame grabbing software and spreadsheet software
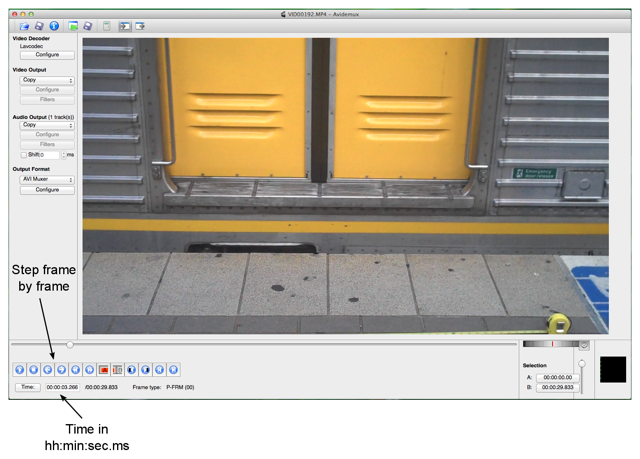
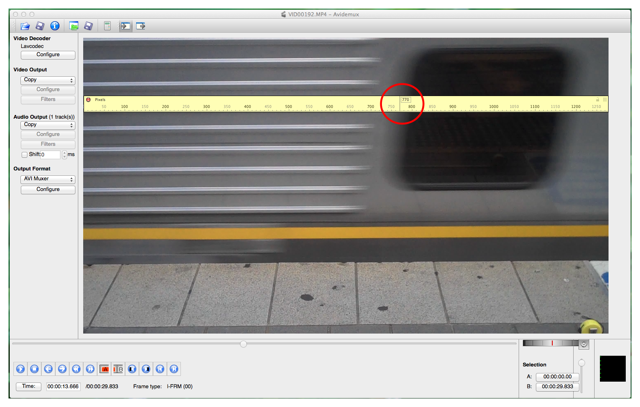
Free video frame grabbing software can be found here: or use any other video software that allows you to move through the material frame-by-frame. Software that allows you to measure pixels on the computer screen can be found here: or use any other software that allows you to measure pixel dimensions on the computer screen. And if you magnify enough, you can count pixels directly. Install the software and use it to open your movie. This screenshot comes from Avidemux but other programs give similar results:
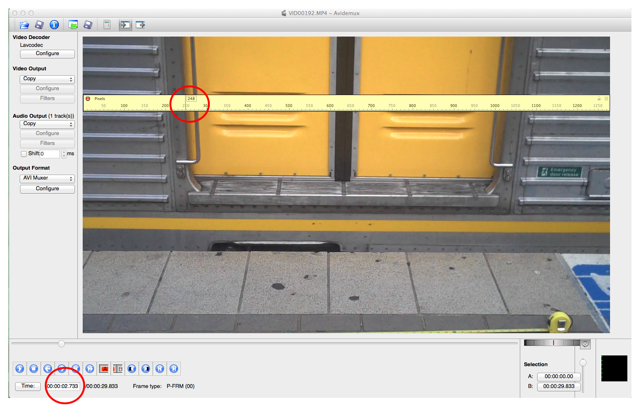
Now use the pixel ruler (We used Pascal Free Ruler) and pick a feature on your object that you can easily identify on the screen. In the example shown below I have chosen the left side of the doorframe as the easily identified object (highlighted with a red circle). Set up like this, I read 248 pixels (the exact location of the ruler on the screen does not matter as long as it is not moved from one pixel measurement to the next):
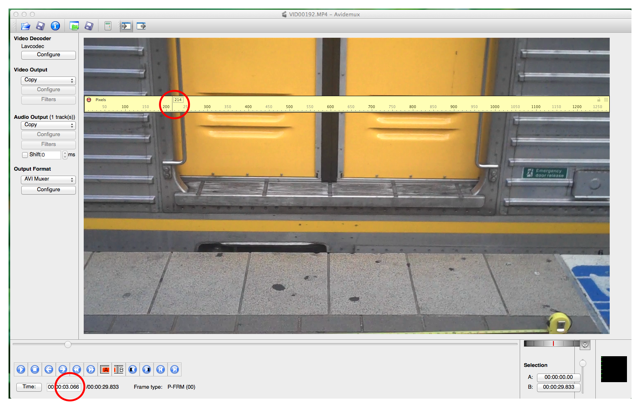
Then you step one or more frames forward in the movie and measure the location of the feature again. The figure above is 2.733 s into the movie; the screenshot below is 3.066 s into the movie. Now the feature is located at 214 pixels:
In ten frames the door has moved by 34 pixels. To turn frames into seconds, you need to know how many frames per second (fps) your camera takes. Ours runs at 30 fps: 1 frame in 33 ms and in our example 10 frames in 330 ms. Relating pixels to distance is more difficult. Sometimes you know the size of your object: For instance, if you filmed a basket ball, you can measure the circumference of the ball with a tape measure and that gives you the diameter of the ball. Or, if you film a car or aeroplane, the manufacturer's website may tell you the length. Here we measured the width of the doorframe (inside the train, for safety!) at 1.22 metres. Measuring the doorframe on screen with the pixel ruler gave us 764 pixels. This gives 1.60 mm per pixel. You may have to use geometry. For instance, to measure an object at distance D from your camera, at right angles, you could position a ruler at distance d from your camera and multiply the distance measured on the ruler by D/d. We measured pixels in the plane of the exterior of the train, not in the plane of the door, because we wanted to use train windows later as reference points and the windows are in the plane of the exterior of the train.
Returning to our example, the train moved 34 pixels, which corresponds to 54 mm or 0.054 m in 10 frames, or 0.33 s, so the speed is 0.054/0.33 m.s-1 or 0.16 m.s-1. In all our measurements we need to consider uncertainties. How precise and accurate are our measurements of length or time? Measured against a clock, the frame rates of typical phone cameras are rather accurate (they have a crystal oscillator). The movie contains 30 frames per second. A first estimate of the uncertainty for the time measurement is 1/30 s, because it low light the camera may record over most of this duration [1]. It is common to give your measurement as (value) ± (uncertainty). The actual value can be above or below the value you give as your measurement. Therefore the time measurement for our movie could be given as (value) ± 1/2 *1/30 s, or (value) ± 0.017 s. We also need to give an uncertainty for the pixel measurement. How certain are we that the feature is exactly located at the given pixel.
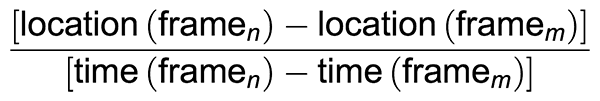
The uncertainty for the pixel measurement will increase as the train gets faster (later in the movie). The image gets blurred as seen in the screenshot above. The feature (left hand side of window frame) is blurred over the range 746 and 794 pixels. We give this as 770 ± 24 pixels, which overestimates somewhat. The uncertainties in the displacement of the chosen feature and the time taken contribute to the uncertainty in the measured velocity of the train. So we must include error bars in the velocity graph. Error bars show visually the uncertainty in the measured and plotted quantities. For the investigation of the velocity of the train there will be error bars for the variable on the x-axis (time elapsed) and error bars for the y-axis (velocity of train). Here, increasing velocity increases the blurring of images and so increasing errors in velocity. Each experimental point on this graph shows train velocity (y coordinate) vs elapsed time (x coordinate). The zero of time could be arbitrary, but one might take the last time at which the train was stationary. To determine the velocity, (distance travelled)/(time elapsed) is calculated:
where the frame numbers n and m are integers. What is the zero for time? We could use the moment when we turn the camera on, but we chose the last frame before the train moved. Here, the train first moved in frame 57 (a time of 1.9 s in the movie), so we subtracted 56 from each frame number before converting to time. Here is our example:
The left column of the table lists the frame number, which can be determined from the time the movie ran divided by 30 as the camera took 30 frames per second. The next column to the right contains the number of pixels a certain feature in the movie moved from one frame to the next. The third column shows the time elapsed since the train started moving. The uncertainty in the time measurement is determined by ½*1/30 as explained earlier. The fifth column of the table lists the distance the train has travelled since it started moving and Δx is the distance it travelled between successive measurements. The error in the distance is determined by how accurately the feature can be measured on the screen. For our movie this uncertainty varied between ± 2 and ± 3 pixels, which corresponds to the stated lengths listed in the table. The second last column contains the velocity that is calculated from ΔPixel after converting it to meters. The last column shows the uncertainty in the velocity. We estimated this by calculating the maximum and minimum velocity for the given measurement. The maximum movement in successive frames is given by ΔPixel plus twice the uncertainty in the pixel measurement. The minimum movement is given by ΔPixel minus twice the uncertainty in the pixel measurement. (This is a simplification commonly used in high school level courses. As explained above, this gives an overestimate of the uncertainty.) We could reduce the uncertainty by using a larger Δt: this would reduce the proportional error in both Δx and Δt. The rest of the analysis is done with spreadsheet software to produce a graph of the data. The software that can be used can be found here: http://www.libreoffice.org/download/
As can be seen in the graph above it is possible to fit a straight line to the data that goes through all error bars, which are overestimates of the error. Note that there are systematic differences: the line lies below the points at either end, and above them in the middle, suggesting an increasing acceleration. Looking at the data, we see a greater acceleration after around 3 s. Therefore in the graph below a straight line has been fitted to the data for times larger than 3 s. It gives an acceleration of 0.53 m.s–2. (One might also fit a line for times between 0 s and 3 s, or perhaps just say that the acceleration isn't constant).
[1] In practice, the uncertainty may be rather better. If there is bright light, the exposure time will be rather less than 1/30 s, so the time between frames may be known rather more precisely than this. But it's better to overestimate than to underestimate
|
|
||||||||