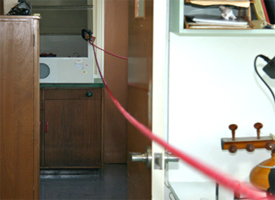
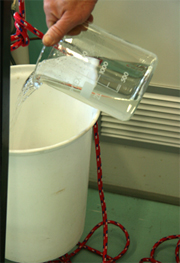
1. In this experiment we use a heavy rope that is stretched between two points located about 9.6 metres apart. A heavy rope and relatively low tension are essential to ensure the speed of the transverse wave is not too high.
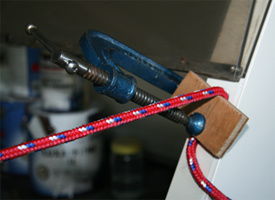
2. One end of the rope was attached to a secure object (in this case a cupboard) via a clamp.
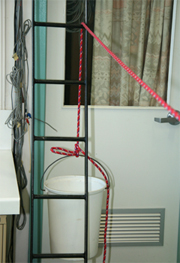
3. The other end of the rope passed over the rung of a fixed ladder and was securely attached to the handle of a bucket.
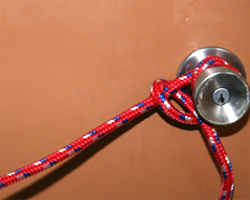
4. IMPORTANT: It is a good idea to secure each free end of the rope at an additional point (in our case we used nearby strong doorknobs). You certainly don't want a rope under tension suddenly becoming free!
5. The bucket was weighed before assembly. The tension in the rope could now be altered by adding known amounts of water to the bucket, remembering that 1 litre of water has a mass of 1 kg. The mass per unit length of the rope was determined by first measuring its total length and then placing it in a plastic bag and weighing it.
6. A travelling wave was then initiated by hitting the rope near one end with the side of the hand (see also "wave speed as a function of tension"). To help determine when the travelling wave returned, we attached a small cable tie to the rope close to the striking point. This amplified any movement of the rope. You might have to experiment with different lengths of cable tie to find one that twitches nicely as each wave passes– see the movie above.
The wave speed can now be found by using a stop watch to time how long it takes the wave to travel along the cable, reflect and come back (we usually measured 10 to 20 complete cycles).
The wave speed is equal to total distance travlled / time taken.
The tension is approximately equal to (mass of bucket + mass of water + mass of rope supporting bucket) x acceleration due to gravity g.
The change in wave speed with change in tension can now be easily investigated.
To make a more quantitative version of this experiment, the rope was passed across a simple pulley rather than across the rung of the ladder. (The rungs of the ladder we used exerted a frictional force on the rope, and so the tension in the rope did not necessarily reflect the tension in the rope supporting the bucket.). The rope was also clamped at the pully after each change in tension so the wave was reflected exactly at the location of the pulley.
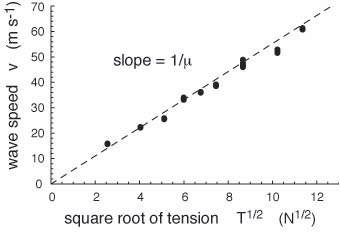
The figure below presents a graph of the results with the measured wave speed plotted against the square root of the tension. The dashed line shows the theoretical relationship v = √(T/μ).
Fig. 1. A plot of measured wave speed v against the square root of tension √T.
There are a number of reasons why the simple theory does not agree exactly with this experiment. Firstly we have not corrected for the extra distance produced by the sagging of the rope at low tensions. We have also not corrected for variation in tension along the rope as it sags. The rope will also have a finite resistance to bending.
If you have a really long rope you can perform this experiment in a long corridor, or even outside. The longer time taken for each wave to reflect and return should allow more accurate measurements of the wave speed. However increased sagging of the rope might make the simple theory less appropriate. See the clip below.
>Here, the tension was supplied by 1 kg masses: 2 kg at left gives 20 N, 8 kg at right gives 80 N. They were chosen so that it would be obvious in the film clip that the tension had been increased by a factor of four (neglecting the weight of the vertical section of rope). For ease in producing a range of different weights, the bucket and water method shown above would be very suitable.
Speed of waves at a water-air boundary
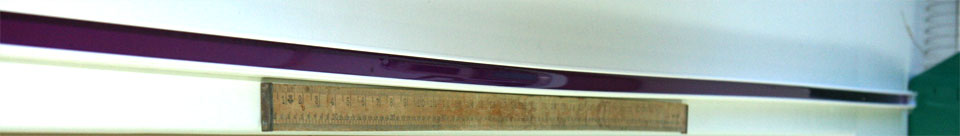
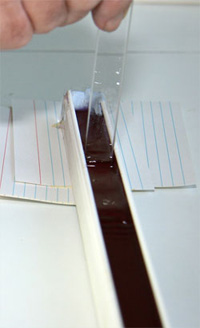
1. In this demonstration we use a long piece of of electrical conduit.
Fig. 2. Both ends are sealed with an adhesive compound (Blu-Tack). It is then partly filled with water that has been stained with a food dye.
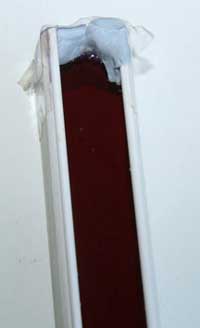
Fig. 3. Movement of a small paddle at one end then initiates a wave.
The restoring force for waves at the water-air boundary is provided by gravity for waves at large wavelengths, but surface tension can make an increasing contribution as the wavelength decreases.
In these movies we have floated small pieces of reflective foil on the surface that show the oscillatory motion undegone by particles in the water as the wave progresses past them.
Wave speed in a streched spring.
Here we use a 'slinky' and time how long it takes a longitudinal wave excited at one end to travel to the far end, reflect and return. It appears the time taken doesn't depend significantly upon how much we extend the slinky. Can you explain why ?
Reflection and transmission of a wave in a string from
discontinuities
In the experiments shown below, the two ropes with different linear density (mass per unit length) were joined by first carefully melting the end of the larger rope with a flame. A hole was then drilled with the same diameter as the smaller rope. A 10 mm section was inserted and the two were then glued together. This increases the bending stiffness slightly at the junction, but the distance over which it acts is small. Knotting the ropes together is simpler, but it adds the extra mass of the knot, which would, in principle, produce reflections. To test the importance of a knot, you could put a knot in the middle of a single rope and see whether reflections are observed at the knot.
At left is an example of high to low μ, while at right we see low to high μ. It is worth studying these clips closely, because there are reflections at both fixed ends as well as at the junction. The reflected and transmitted waves are then superposed.
Sound pressure vs distance from source
The film clip below shows a simple method of investigating how sound pressure varies with distance from the source. An alarm clock is used as the source because it has a distinctive sound that is readily recognised, not only by a listener, but also in a plot of the pressure (p) as a function of time (t).
The pressure can be measured by a microphone and recorded on a computer and viewed using sound recording software. An excellent example of suitable open source software is Audacity; free downloads for Mac and Windows are available at audacity.sourceforge.net . We used our video recording to measure the approximate distance between the source and microphone. A better approach might be to measure the distance more precisely and say each result out loud, so it is recorded onto your sound file for later analysis.
We performed this experiment outdoors to minimise reflections.
Here you should plot the results, for instance amplitude vs 1/r. Here are some questions to consider: At what distance would you expect reflections to cause problems? How well does the source approximate a point? Is the radiation isotropic? By the way, the sound from this source was definitely not sinusoidal, and the asymmetry of the waveform shown is not an artifact.
A wave on the surface of water radiates in 2 dimensions.
Here we let drops of water fall onto a still surface, to produce a localised wave train. Experiments like this show the decrease in amplitude with distance radiated from a point source in two dimensions. Interesting effects are observed when the waves reflect from boundaries. We shall return to look at these in more detail in the chapter on interference.