Young's experiment demonstrates interference of waves from two similar sources. It is a classic demonstration of the interference and of the nature of waves. Here we look first at Young's experiment using water waves, where the displacements due to the waves can be seen directly, as at right. Then we analyse Young's experiment using laser light.
Young, a contemporary of Newton, performed his celebrated experiment with light, to demonstrate its wave nature. Here, we'll look first at a similar experiment using water waves, for which the displacements are visible. Two pencils attached to a frame are being sinusoidally vibrated in the vertical direction. They touch the water and create waves that spread out radially.
Young's experiment using coherent sources of water waves.
A similar experiment at a higher frequency.
In the upper views, on the axis of symmetry, we can see
constructive interference: along this line, the combined waves from the two sources has maximum amplitude. In the left images, this is marked by a red line on both the upper and lower views. This is called constructive interference and it creates an antinode in the wave pattern.
A little to the left of that line, we can see a line where the wave combination hardly disturbs the water at all: destructive interference or a node. This is marked by a blue line on both views. Along this blue line, the distance from the two sources differs by half a wavelength, hence the destructive interference: the waves arrive there half a cycle out of phase.
To the left of both lines, there is another line of antinode, again marked with a red line. Along this line, the distance from the two sources differs by one wavelength. The pattern of nodal and antinodal lines continues all the way around the two sources.
The two different views are of the same apparatus, taken from different angles. In the upper shot, we see the waves on the water surface. On the lower, we see the distribution of light intensity due to the refaction of light by the waves. In the experiment above, the clip is cycling over seven frames. For this frequency, the lower view is not very clear. For that reason, we show below a slightly higher frequency.
In the clip at right, the frequency is about 15% higher. This time the lower view is clear, but the upper view is less clear. By the way: for waves of this size, both the surface tension of water and gravity contribute to the restoring force, so the wave speed is not constant, but is a complicated function of the wavelength, so wavelength and period are not proportional.
Young's experiment with laser light
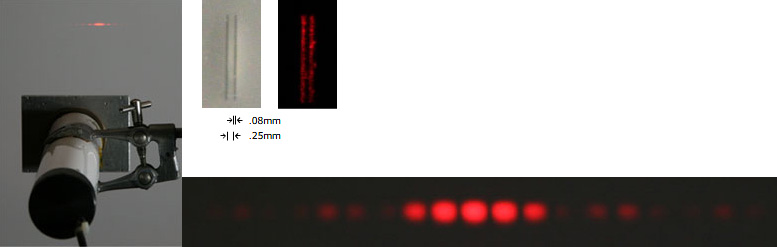
Young conducted his eponymous experiment with light. Here, light from a helium-neon laser illuminates two parallel slits cut in a metal foil. The slit separation is 0.25 mm and their width is 0.08 mm.
At left, we look towards the screen from above a laser (in the clamp). In front of the laser is a metal foil with two parallel slits cut in it. Top middle pictures show it illuminated from in front with white light and from behind with laser light. On the screen in the image at left, we can see the interference pattern. This is shown in close-up at bottom right.
We can see an analogy with the water experiment above: on the axis of symmetry, we see a bright spot, where light from the two sources interferes constructively. A little to the left, a node (black in the pattern). Then an antinode (bright red) where the distance from the two slits must differ by one wavelength. Let's look at the geometry in another diagram.
Young's experiment: the geometry
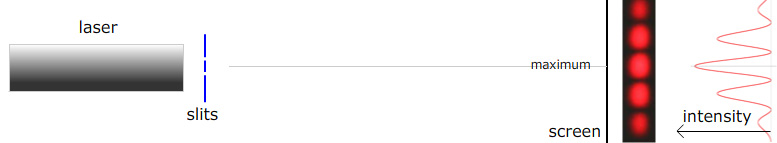
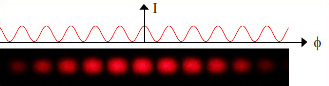
The schematic below shows (not to scale) the relative arrangement of laser, slits and screen (seen from above). The photograph shows the interference pattern. Next to that is a plot of the calculated intensity – we'll return to this below. The central maximum lies on the axis of symmetry: this point on the screen is equidistant from the two slits, so the two waves arrive in phase. On either side we see the first order maxima: also bright regions of the image, where the distances from the two slits differ by one wavelength, which again gives constructive interference. Between them lies a dark patch, where the distances differ by one half wavelength, which produces destructive interference.
A schematic of Young's experiment with the observed interference pattern and its calculated intensity
It's interesting to note that the photographed pattern doesn't 'look like' the intensity graph plotted beside it. We return to this below.
Comparison: Young's experiment with water waves and with light
The next illustration is a montage of the two different Young's experiments:
consider a horizontal lineabout halfway between the pencils and the bottom of the image
and compare it with the image from the laser experiment shown below.
(The mapping is not exact, because the optical experiment has a small angle, so sin θ ~ θ, while the water wave pattern occurs over a large angle – in fact, we can observe it over 360°.)
A montage to show the similarities of the interference patters for two coherent water wave sources (top) and coherent light sources (bottom).
So both water waves and light exhibit interference – a property of waves. But does this explain how light casts shadows? Go to this page about Shadows, particles and waves. This link will return you to the multimedia tutorial The Nature of Light.
Pathlengths and interference
If we look down on a Young's experiment from above, what do we see? From the two sources (two slits for light) wave fronts spread out symmetrically in all directions. The animation shows this for the water waves, which radiate in all directions. For light, the radiation spreads over only a small angle, as we'll see later.
Wavefronts spreading from two coherent sources in phase.
In the animation above, grey circles are wavefronts. The pink lines show loci of constructive interference. The black lines show points where the path difference from the two slits differs by an integral number of wavelengths. Grey straight lines are loci of destructive interference.
Small angle approximation
For Young's experiment with light, the distance L to the screen is typically very much greater the distance between slits, so lines drawn from a point on the screen to each of the slits are almost parallel, an approximation we'll use next. (Further, the interference pattern is usually spread over a very small angle, so the small angle approximation is usually appropriate.)
Finding the angular position of maxima and minima
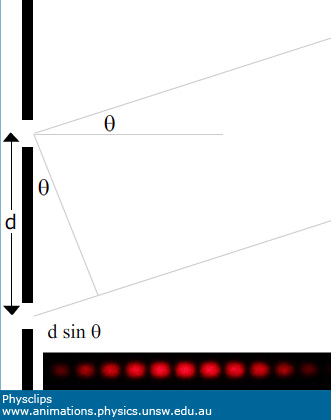
The geometry of two lines meeting at the screen, and at angle θ to the normal. Inset: an interference pattern seen on the screen.
The distance between the slits is d. Consider paths from the two slits at angle θ. From the (almost) right angle triangle shown, the difference in path length to the screen from the two slits is
Δ pathlength = d sin θ
Divide this by the wavelength to get the number of cycles out of phase, and it follows that the phase difference at the screen, in radians, is
φ = 2π(d sin θ)/λ
(1)
For constructive interference, which means the maxima in brightness in the pattern, the phase difference should be 0, 2π, 4π etc, i.e.
d sin θ = mλ where m is an integer.
For destructive interference, the minima in brightness, the phase difference should be π, 3π etc, i.e.
d sin θ = (m − ½)λ where m is an integer.
m is called the order of the maximum or minimum, so the central maximum is the zeroth order, with the first order minima on either side.
So, now we know where the maxima and minima are. But why this pattern? How does the intensity vary over the pattern?
Phasors: calculating the interference intensity as a function of angle
The electric field vectors due to the two interfering waves add up, but the addition involves a phase difference. We can calculate the sum of quantities that vary with the same frequency using phasors (See Phasors for an introduction).
Briefly, we represent each quantity with a vector. The vector magnitude is the magnitude of our oscillating quantity, and its angle is the phase of our quantity.
Phasors with phase difference zero (or 2mπ etc)
Phasors with phase difference φ
The phasors in our example have the same magnitude A because the two slits are approximately equidistant from the screen. The phase φ varies as we move away from the midpoint of the pattern, as shown in the previous section. At θ = 0, φ = 0 and the resultant has a magnitude of 2A, as shown at left. The diagram at right shows an arbitrary phase difference φ. Looking at the two similar right angle triangles, each with angle φ/2, we can see that the phasor sum has magnitude 2A.cos (φ/2).
As for the other waves studied in previous chapters, the intensity of light is proportional to the square of the amplitude. So let's write the intensity at θ = 0 as I0 = k(2A)2, where k is a constant of proportionality. The intensity at angle θ is then I(θ) = k(2A.cos (φ/2))2. We can use the intensity at θ = 0 to substitute for the constant k, which gives us:
I = I0 cos2 (φ/2) where φ = 2π(d sin θ)/λ
and where the expression for φ was given in equation (1) above.
The expression given above is derived considering interference for two sources of negligible size. Let's compare this prediction with the observed interference pattern:
cos2 (φ/2) vs. the image
Looking at the image, we can see two ways in which it doesn't look like a cos2 function. First, the maxima become weaker as we go further from the centre of the pattern. This is the result of diffraction, which is due to For a Young's experiment using radio waves, it is easy to make the source dimensions much smaller than the distance between them. This is not at all easy for light and, as we shall see below, the finite size of the slits contributes a broader pattern that modulates the cos2 function.
Looking at the image, we also notice that the brightness of the maxima does not appear to vary much – it looks as though the brightness saturates over nearly a third of a cycle. The main reason is the nonlinear response of the eye to light intensity: the eye has a dynamic range of about 90 dB, and this cannot be achieved with a linear response. (The camera also has a nonlinear response but the image looks much like this to the naked eye, as well.) So let's check
Measuring the intensity as a function of angle
Scanning across the interference pattern with a photodetector circuit.
Here, a phototransistor is illuminated by the interference pattern. Due to the photovoltaic effect, each photon captured by the base emitter junction (used here as a photodiode) provides a conduction electron, so the diode current is proportional to the number of photons. This current is input to an operational amplifier, whose feedback resistor converts it to a voltage, so the voltage shown on the oscilloscope is proportiotnal to the rate of photon capture. The scanning across the pattern is done by my hand, which does not move at exactly constant speed. Consequently, the recorded shape is not precisely cos2, but it does show the clear peak with no saturation.
Why does more light make the pattern darker?
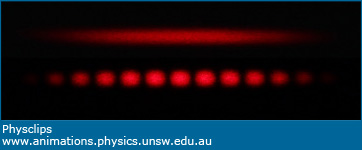
The photograph below shows, at top, the pattern produced by a single slit. (The weak variation in intensity with angle is due to diffraction, which we discuss in the next chapter.) Below that pattern is the pattern produced by the two slits.
The pattern produced by a single slit (top) and that due to two such slits.
So here arise the remarkable questions about interference. The intensity of light is proportional to the rate of photon arrivals. Two slits admit twice as many photons so, on a.verage, the lower pattern must be twice as bright as the upper.
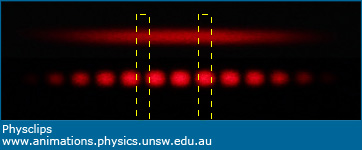
Twice as many photons gives less light. Look, however, at the yellow rectangle at left, located at a minimum in the interference pattern. At this point, doubling the number of photos passing through the slits has decreased the light intensity. In the wave picture, we know why: the electric fields due to the waves coming from the two slits cancel out, giving negligible electric field and so negligible intensity: destructive interference. Nevertheless, it is interesting that, at this point, adding more photons removes light!
Twice as many photons gives four times as much light. Next, look at the yellow rectangle at right, located at a maximum in the interference pattern. At this point, doubling the number of photos passing through the slits increases the light intensity by a factor of four (see equation (1) above). In the wave picture, we know why: the electric fields due to the waves coming from the two slits are in phase, which doubles the electric field and so gives four times the intensity: constructive interference. Nevertheless, it is interesting that, at this point, twice as many photons give four times as much light!
There is no magic here: the photons are differently distributed between the two patterns: at the maxima, there are four times as many in the interference pattern, at the minima none. So, on average over the pattern, there are twice as many photons from two slits as there are from one. The interference pattern determines the probability of capturing photons. We'll look at this again when we do Young's experiment, one photon at a time.
Combination of interference and diffraction
As mentioned above, the patterns shown above exhibit the combined effects of diffraction (the upper photograph above) and interference (the cos2 term). More on this when we have published the next chapter, on Diffraction.